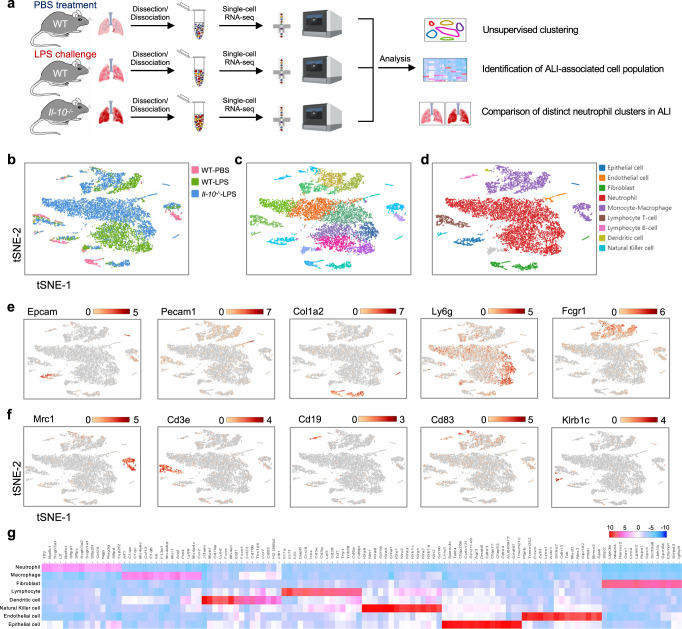
Fig. 3. Identification of distinct cell populations in mouse lung tissues by Single-cell RNA sequencing.
a Schematic diagram of our experimental design. Some figure elements were created with BioRender.com. b, c The t-SNE representation of aligned gene expression data in single cells collected from WT control (1,129 cells), WT LPS-treated (4,478 cells) and Il-10−/− LPS-treated (6,518 cells) mouse lung samples showed cellular origins (b) and partitioned into 18 distinct clusters (c). d Unsupervised clustering identified 9 major pulmonary cell subsets. Each point depicts a single cell, colored based on the cluster designation. e, f Gene expression profiles projected onto t-SNE plots for Epcam, Pecam1, Col1a2, Ly6g, Fcgr1, Mrc1, Cd3e, Cd19, Cd83 and Klrb1c (scale: log-transformed gene expression). g A heatmap exhibiting the 15 most enriched genes used for biological identification of each cluster defined in panel D (scale: Log2 fold change). WT-PBS, n = 1 sample; WT-LPS, n = 2 samples; KO-LPS, n = 2 samples.

