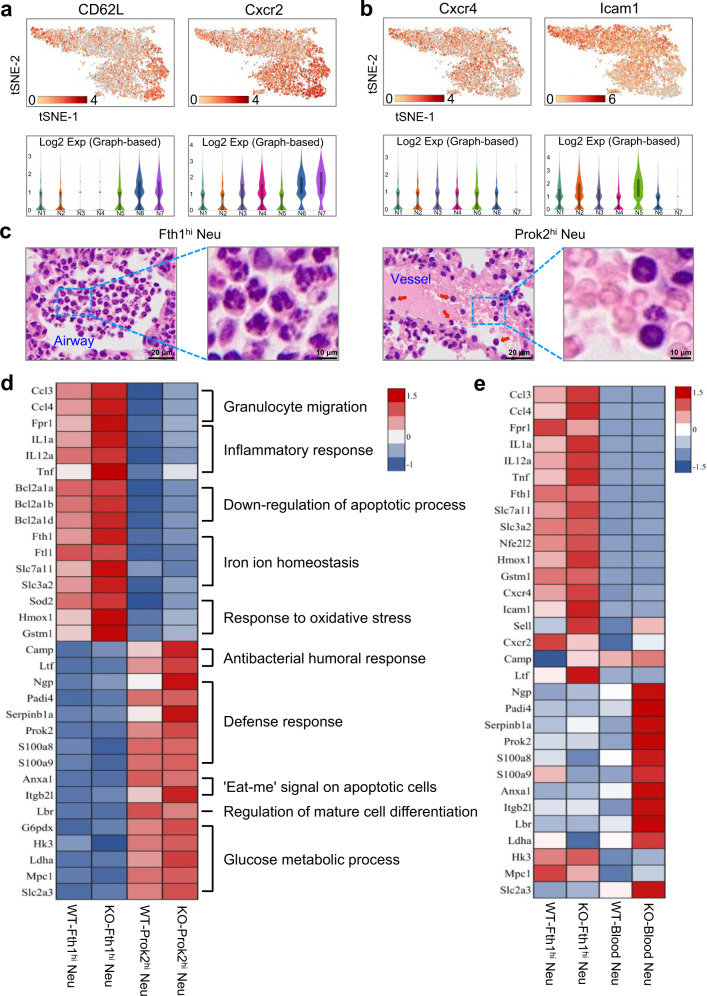
Fig. 5. Functional and morphological heterogeneity of two neutrophil subsets in ALI lungs.
a, b The gene expression profiles projected onto t-SNE plots and corresponding violin plots for CD62L, Cxcr2, Cxcr4 and Icam1 (scale: log-transformed gene expression). Boxes within violin plot show the median ± 1 quartile, with the whiskers extending from the hinge to the smallest or largest value within 1.5× interquartile range from the box boundaries. n = 1657, 1601, 1067, 953, 836, 572, 501 for N1-N7. c Representative micrographs of H&E-stained Fth1hi and Prok2hi Neu in lung samples from mouse at 24 h post-exposure. Red arrowheads indicate the Prok2hi Neu in pulmonary vessels. Scale bars in the left column, 20 µm; scale bars in the right column, 10 µm. Three independent experiments with similar results were performed. d, e Heatmaps of selected enriched genes used for biological function identification of each cluster standardized by Z-score. Source data are provided as a Source Data file.

