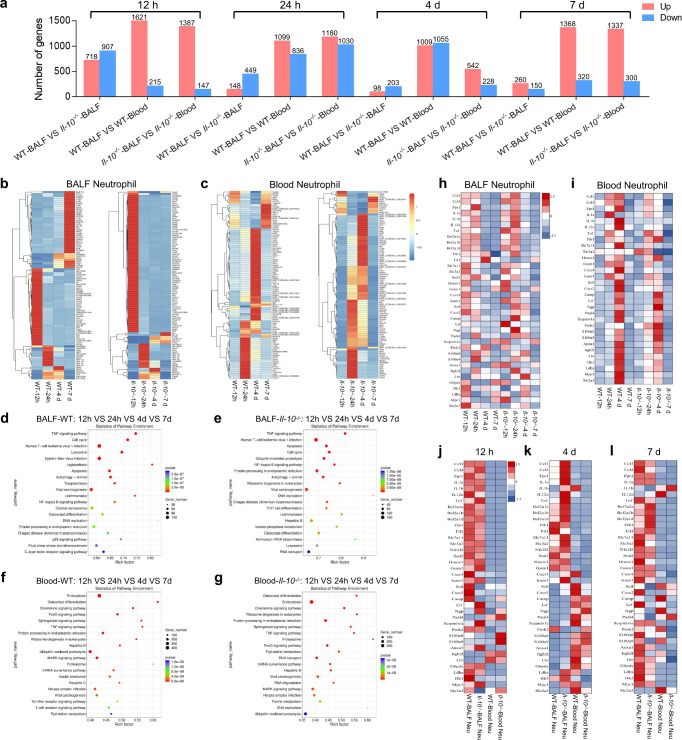
Fig. 8. Global effects of IL-10 on the transcriptomes of neutrophils extracted from BALF and blood at various time points after LPS stimulation.
a Numbers of differentially expressed genes in neutrophils from various groups. b, c Heatmaps showing the most highly differentially expressed genes in BALF (b) and blood (c) neutrophils from different groups. d–g KEGG pathway analyses of BALF (d, e) and blood (f, g) neutrophils from different treatment groups. The statistical analysis was performed by Fisher’s test. h, i Heatmaps of selected enriched genes used for biological identification of BALF (h) and blood (i) neutrophils after different treatments, standardized by Z-score. j–l Heatmaps of selected enriched genes used for biological identification of neutrophils from distinct groups at 12 h (j), 4 d (k) and 7 d (l) post-exposure. n = 4 samples per group. VS, versus. Source data are provided as a Source Data file.

