FIGURE 6.
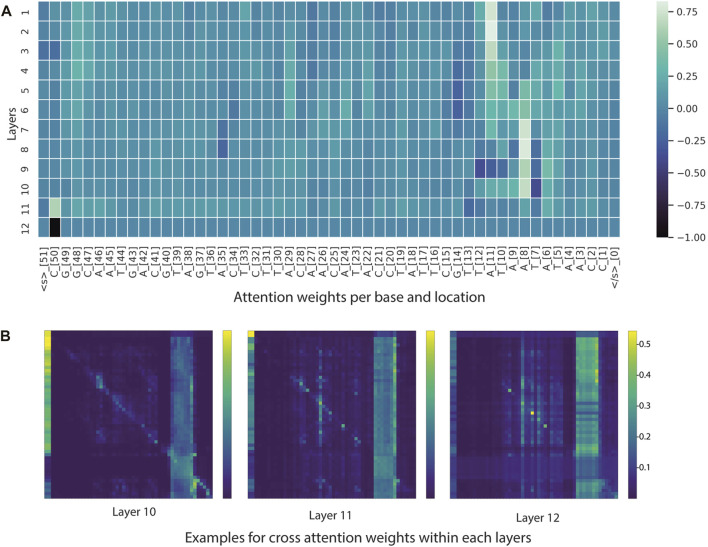
Visualization tools for model interpretability. (A) Heatmap based on attention scores of nucleotides (tokens) across 12 layers. (B) Heatmap illustrating cross-attention scores of nucleotides (tokens) in the last three layers. In the example heatmap, the self-attention modules focused on -10 element and some positions in the -35 element.

