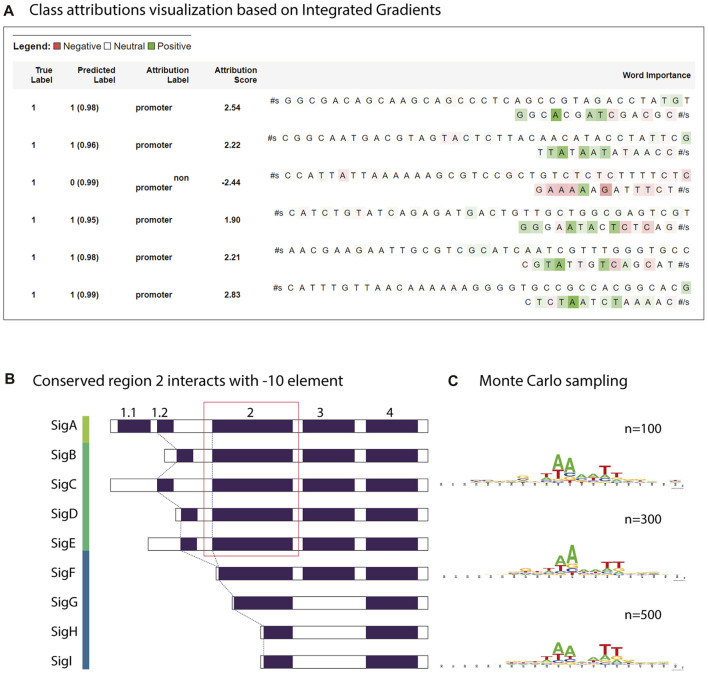
FIGURE 7.
Motif analysis using attribution weights and reverse enrichment through Monte Carlo sampling. (A) Class attributions visualization of a few strong promoters in Synechococcus elongatus sp. UTEX 2973 and a non-promoter sequence. (B) Transcription factor groups in Synechocystis sp. PCC 6803. The relatively conserved region two in group 1 and group 2 retains a motif similar to the consensus -10 element TATAAT. (C) The motif learned by the trained model discovered by Monte Carlo sampling.

