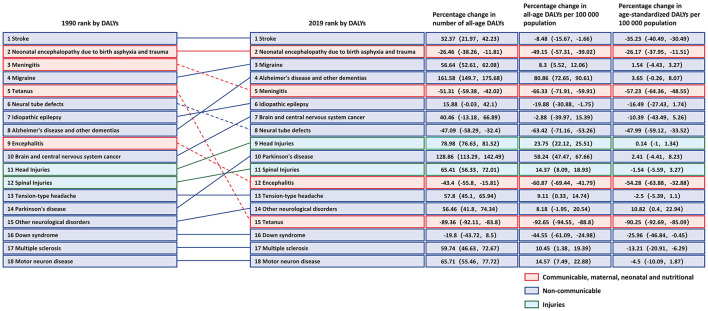
Figure 1.
Changes in rank and percentage of global DALYs, in terms of total DALYs, percentage change in numbers of DALYs and age-standardized DALY rates due to 18 neurological disorders for all ages and both sexes from 1990 to 2019. Solid lines indicate an increase in rank while dashed lines represent a decrease in rank.

