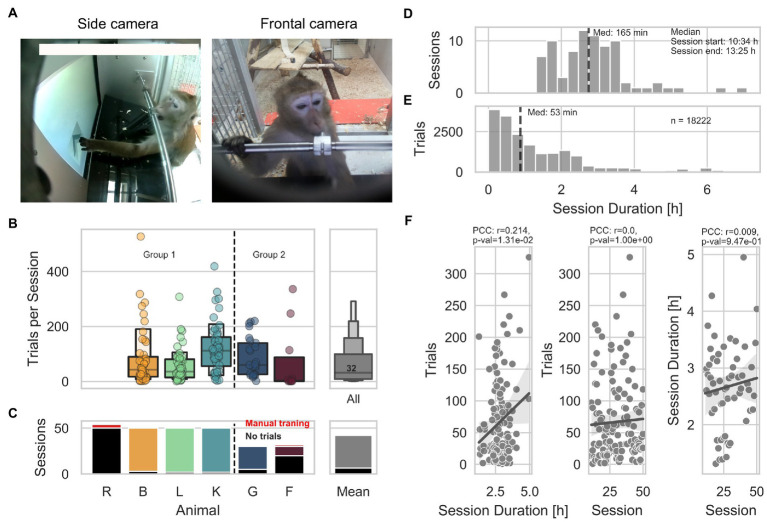
Figure 1.
General engagement across sessions. (A) Pictures of animal L interacting with the LXBI device. The left picture shows the view from the side camera used for surveillance during sessions. The right picture shows the view from the frontal camera used for animal identification. (B) Left panel shows the number of trials per session across animals. The right panel shows the distribution across all animals, with a median of 32 trials per session (IQR = 90 trials). (C) Left panel shows the number of sessions across animals. Red indicates the amount of manual training sessions conducted in separation from the rest of the group. Black indicates the amount of sessions with no trials. The right panel shows the mean across animals. (D) Distribution of all session durations. The dashed line indicates the median of the distribution. (E) Distribution of trial initiation across session duration. The dashed line indicates the median of the distribution. (F) From right to left. Distribution of number of trials per animal as a function of session duration, shows a significant positive correlation (partial Pearson’s correlation, n = 135, r = 0.213, CI95% = [0.05, 0.37], p = 0.01). Distribution of number of trials per animal as a function of session number, shows non-significant correlation (partial Pearson’s correlation, n = 135, r = 0.00008, CI95% = [−0.17, 0.17], p = 0.99). Distribution of session duration as a function of session number shows no significant correlation (partial Pearson’s correlation, n = 59, r = 0.0088, CI95% = [−0.25, 0.27], p = 0.94).

