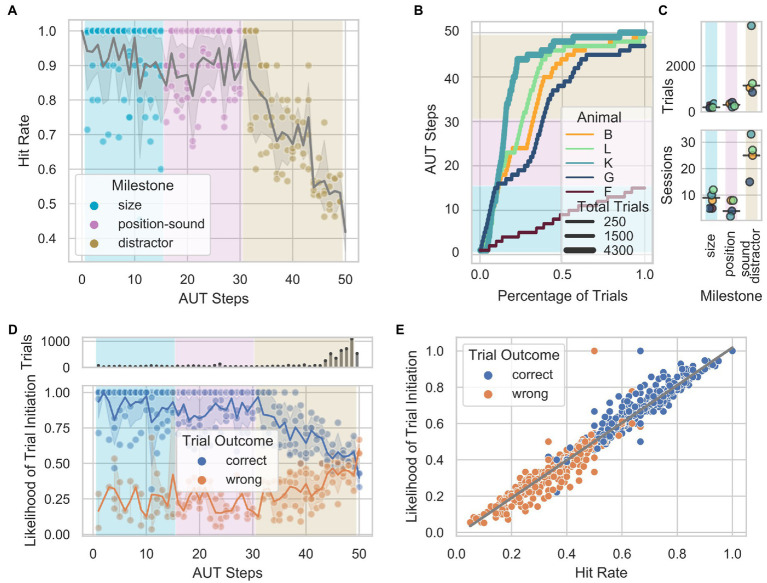
Figure 2.
Performance through the Automated Unsupervised Training (AUT) protocol. (A) Hit rate as a function of AUT steps per animal. Gray shade represents 95% confidence interval of the mean across animals. (B) Animal progress through the steps of the AUT protocol. Background colors indicate the milestones. (C) From top to bottom, number of trials and number of sessions as a function of milestones across animals. (D) Distribution of the likelihood of trial initiation as a function of hit rate in blocks of 100 randomly selected trials across animals. The upper panel shows the number of trials per step. (E) Highly significant positive correlation between the hit rate and the likelihood of initiating a trial when controlling for the non-uniform number of trials across steps (partial Pearson’s correlation, n = 840, r = 0.98, CI95% = [−0.98, 0.98], p =5e-18).

