Figure 3.
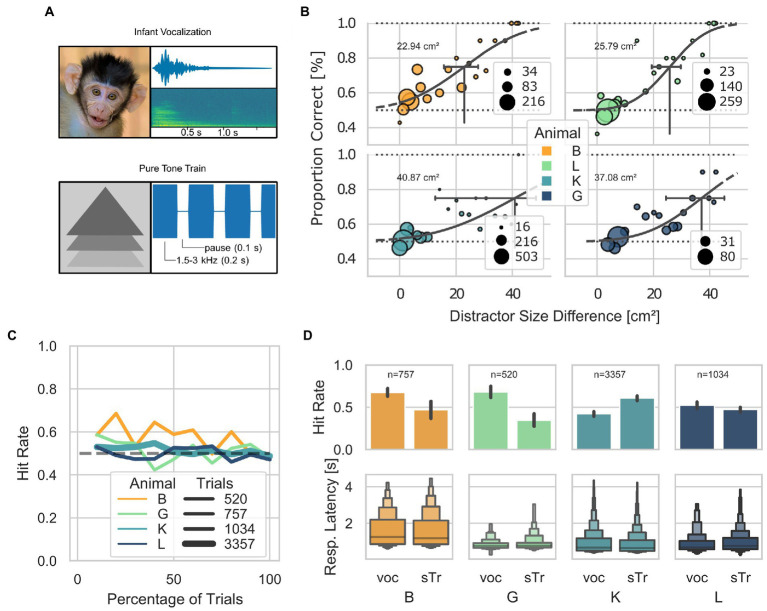
Visually guided discrimination task. (A) Visual and acoustic stimuli used across the AUT (milestones position-sound and distractor) and in step 50. Visual stimuli are shown on the left, and the spectro-temporal information of the acoustic stimuli is shown on the right. The pure tone train was 4 kHz. (B) Psychometric curves for the minimum size difference between distractor and target, calculated as the proportions of correct trials across steps of the AUT. 95% confidence intervals (CI) are indicated with black horizontal lines (Animal B: threshold 22.94 cm2; CI between 15.7 and 26.7; L: 25.79 cm2, CI between 19.4 and 28.9; K: 40.87 cm2, CI between 12.6 and 46.4; G: 37.08 cm2, CI between 24.4 and 43.3). (C) Hit rate as a function of the percentage of trials performed by each animal (after step 44 where all animals mostly performed below 60% hit rate), grouped into bins of 10%. The thickness of the lines represents the number of trials. The dashed line at 0.5 represents the chance level. (D) Letter-value plots show the reaction times for each stimulus across animals after step 44. The central box represents the 1st quartile, 2nd quartile and 3rd quartile. No statistical difference was found between the response latencies between stimuli at a Bonferroni post-hoc-corrected Kruskal–Wallis Test (B p = 0.19, G p = 0.17, K p = 0.18, L p = 0.09).

