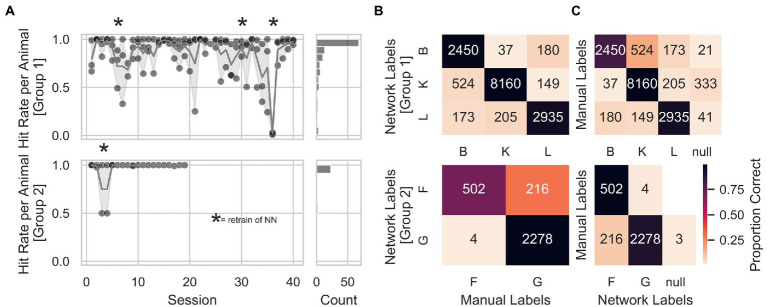
Figure 4.
Animal identification accuracy. (A) Animal identification accuracy across sessions for Group 1 on the upper right panel and Group 2 on the lower right panel. The right panels show a count histogram for both groups. (B) Individual animal identification accuracies were calculated as the number of times labels from the network-matched manual labels, divided by the total number of network labels for that animal. Accuracies for Group 1 were around 90%. At the same time, for Group 2, animal G held an identification accuracy of almost 100% and animal F of 70%. (C) General measure of accuracy for each animal, calculated by dividing the number of times labels from the network-matched manual labels by the total amount of manual labels for that given animal. Again, accuracies were above 90% in Group 1 and between 77 and 89% in Group 2. An additional animal label, called null, was assigned to those pictures where the animal’s identity was unclear (animals triggering a trial by accident, e.g., with their back). Numbers inside the heatmap represent the number of trials from which the hit rate was calculated.

