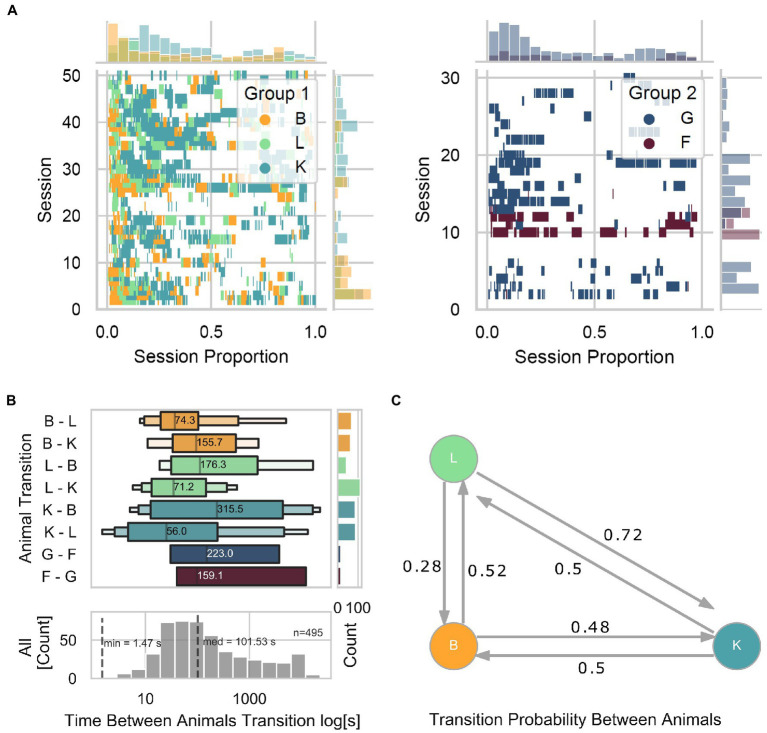
Figure 5.
Turn-taking. (A) Event plot showing each animal’s individual trial initiation as a function of session proportion. Left panel for Group 1 and right panel for Group 2. Marginal plots show the density histograms of trial initiation instances across sessions on the ordinate and within sessions on the abscissa. (B) The upper panel shows the time distribution between animal transitions across all animals. The lower panel shows the distribution when merging all animals. The marginal plot is a count histogram for the number of transitions. (C) Markov transition matrix, showing the probability of transitions among animals.

