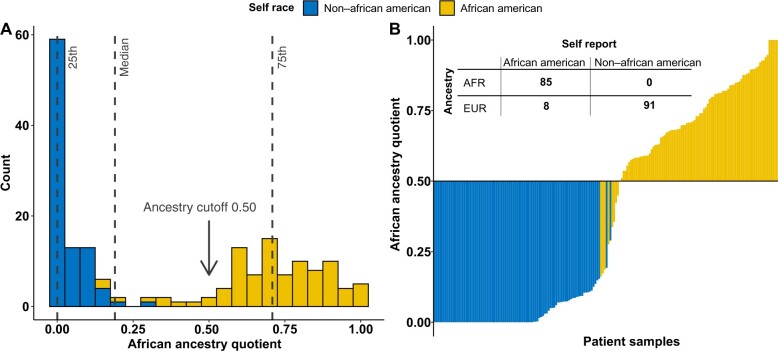
Figure 4.
Ancestry determination in VANDAAM samples. A) Figure presents the African ancestry quotient on the x-axis to show its distribution across all the patients who underwent genotyping (n = 184). We overlayed the ancestry distribution with the self-defined race group to determine optimal cut point for African ancestry quotient to dichotomize race groups. At 0.50 and above, nearly all the self-reported African American patients shared African ancestry and were categorized as AFR, whereas others were grouped as EUR. B) Waterfall figure shows patient samples on y-axis and their ancestry quotient on x-axis. Samples were sorted based on their quotients and were overlayed with self-reported race group. The right side represents all the self-reported African American men with ancestry quotient above 0.50. Whereas on the left side, 8 self-reported African American men were considered as being misclassified and were grouped as EUR in ancestry table. The ancestry table presents the overlap of the patients between self-reported race and ancestry-based race categories. At African ancestry quotient of 0.50, no misclassification in non–African American men was noted, whereas only 8 self-reported African American men were misclassified out of 93. AAM = African American men; AFR = African ancestry; EUR = European ancestry; NAAM = non–African American men.

