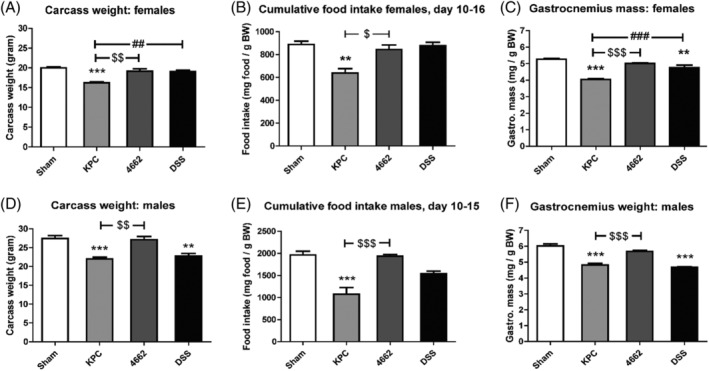
Figure 1.

Carcass weight, food intake change and gastrocnemius weight in 4662‐induced and KPC‐induced cachexia. Carcass weight on day 16 in female mice (A) and male mice (D). Cumulative food intake during cachexia phase in female mice (B) and male mice (E). Gastrocnemius weight on day 16 in female mice (C) and male mice (F). Carcass weight was calculated by subtracting tumour weight from body weight on day of sacrifice. Gastrocnemius weight was related to initial body weight. For female mice, n = 3, 4, 4 in sham, KPC and 4662 groups, respectively. For male mice, n = 6, 4, 4 in sham, KPC and 4662 groups, respectively. *P < 0.05, ** P < 0.01, *** P < 0.001 compared with sham; $ P < 0.05, $$ P < 0.01, $$$ P < 0.001 compared with 4662; # P < 0.05, ## P < 0.01, ### P < 0.001 compared with DSS. One‐way ANOVA analysis of variance with post hoc Bonferroni's multiple comparison test.
