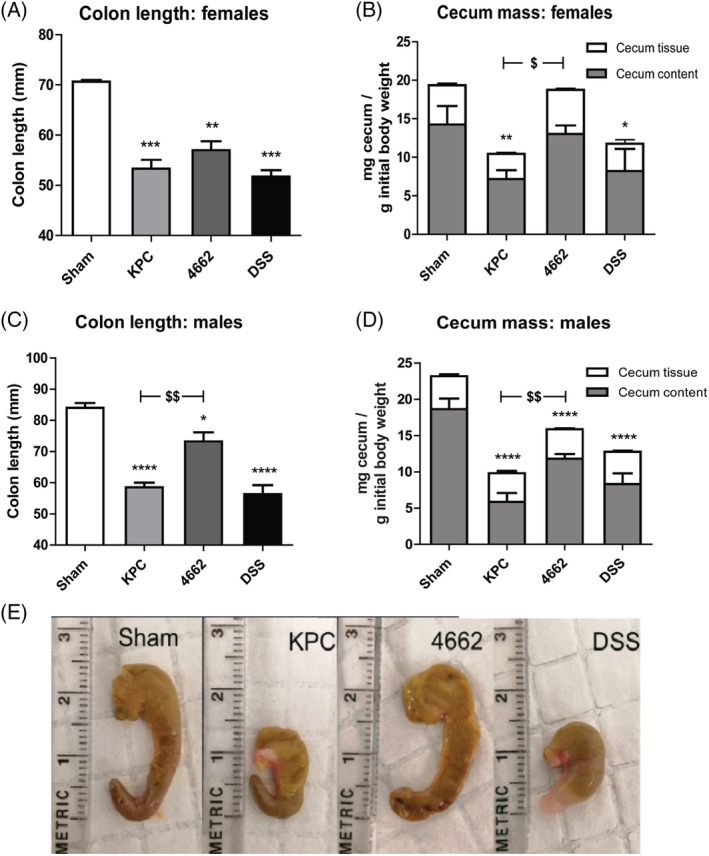
Figure 2.

Colon length, cecum mass change and gross appearance of the cecum in sham, KPC, 4662 and DSS mice. For female mice, n = 3, 3, 4 in sham, KPC and 4,662 groups respectively. For male mice, n = 6, 4, 4 in sham, KPC and 4,662 groups respectively. *P < 0.05, **P < 0.01, ***P < 0.001, ****P < 0.0001 compared with sham; $ P < 0.05, $$ P < 0.01 compared with 4662. One‐way ANOVA analysis of variance with post hoc Bonferroni's multiple comparison test.
