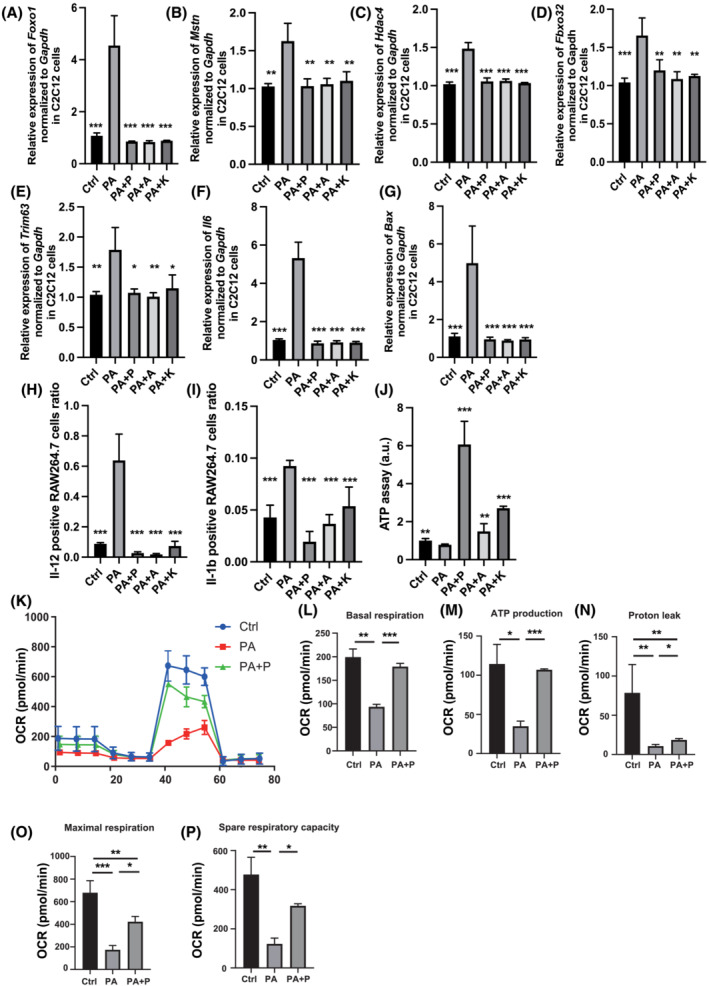
Figure 5.

Administration of propolis protected against muscle atrophy and mitochondrial dysfunction induced by saturated fatty acid in C2C12 myotube cells. Relative mRNA expression of (A) Foxo1, (B) Mstn, (C) Hdac4, (D) Fbxo32, (E) Trim63, (F) Il6 and (G) Bax in C2C12 myotube cells treated with ethanol (Ctrl), 200 μM palmitic acid (PA), 200 μM PA and 100 μg/mL propolis (PA + P) normalized to the expression of Gapdh (n = 6). (H) Ratio of Il‐12 + RAW264.7 cells in F4/80 + CD11b + cells treated with ethanol (Ctrl), 200 μM palmitic acid (PA), 200 μM PA and 100 μg/mL propolis (PA + P) (n = 6). (I) Ratio of Il‐1β + RAW264.7 cells in F4/80 + CD11b + cells treated with ethanol (Ctrl), 200 μM PA, 200 μM PA and 100 μg/mL propolis (PA + P) (n = 6). (J) ATP assay following treatment with ethanol (Ctrl), 200 μM palmitic acid (PA) or 200 μM PA and 100 μg/mL of propolis (PA + P), 10.6 μg/mL of artepillin C (PA + A) or 1.89 μg/mL of kaempferide (PA + K) (n = 6). (K) Raw data for oxygen consumption rate (OCR), (L) basal respiration, (M) ATP‐linked respiration (oligomycin‐sensitive OCR), (N) proton leak, (O) maximal mitochondrial respiration (FCCP‐stimulated OCR) and (P) spare respiratory capacity. OCRs were normalized to the total number of cells. Data are represented as the mean ± SD values. Data were analysed using one‐way ANOVA with Holm–Šídák's multiple‐comparisons test. *P < 0.05, **P < 0.01, ***P < 0.001.
