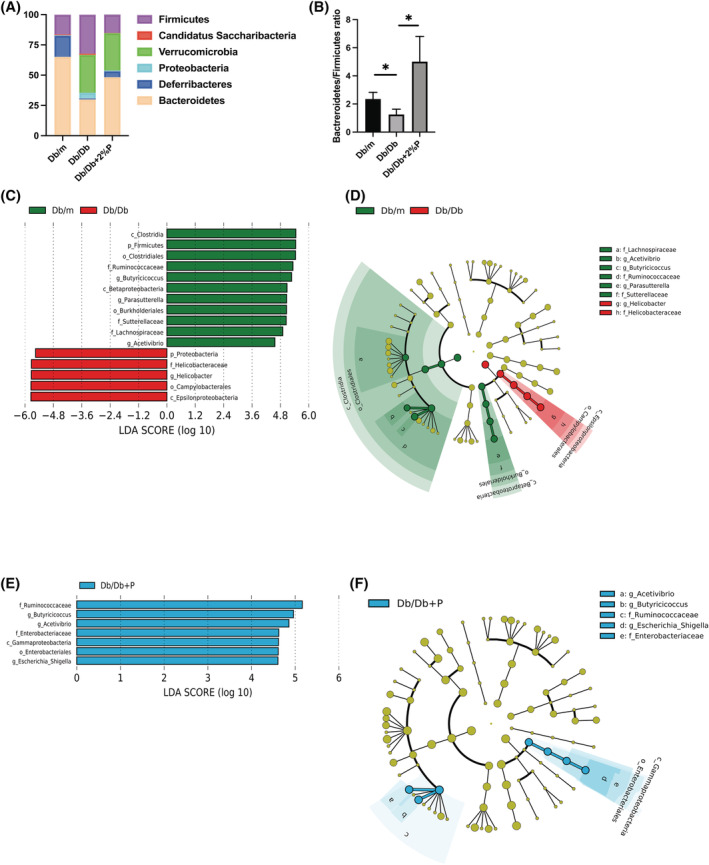
Figure 6.

Components and functional profiles of the gut microbiota. (A) Relative abundance of gut microbiota at the phylum level (n = 3). (B) Ratio of the phylum Bacteroidetes in Firmicutes (n = 3). Data are the mean ± SD values. Data were analysed using one‐way ANOVA with Holm–Šídák's multiple‐comparisons test. *P < 0.05, as determined by one‐way ANOVA. The influence of genera on unique gut microbiota in Db/m mice, Db/Db mice and Db/Db + 2%P mice was assessed by LEfSe analysis (n = 3). (C and E) LDA scores of gut microbiota of Db/m and Db/Db + 2%P (green) and Db/Db (red) mice. (D and F) LEfSe was used to identify the taxa with the greatest differences in abundance between the gut microbiota of Db/m (Db/Db + 2%P) and Db/Db mice. Db/m mice (green); Db/Db mice (red); Db/Db + 2%P mice (blue). The brightness of each dot is proportional to the effect size. Only taxa with a significant LDA threshold value >2 are shown.
