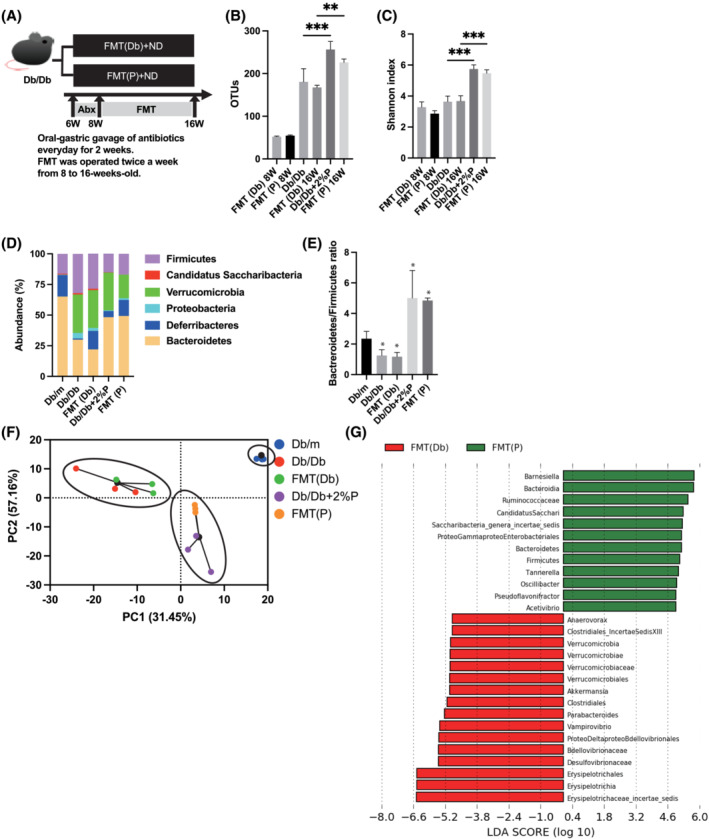
Figure 7.

Faecal microbiota transplantation of Db/Db mice and Db/Db+2%P mice to recipient mice. (A) Oral‐gastric gavage of antibiotics was performed every day for 2 weeks. FMT was operated twice a week from 8 to 16 weeks old. (B) OTUs (n = 3). (C) Shannon‐index (n = 3). (D) Relative abundance of gut microbiota at the phylum level (n = 3). (E) Ratio of the phylum Bacteroidetes in Firmicutes (n = 3). (F) PCA and k‐means clustering for gut microbiota. (G) LDA scores of gut microbiota of FMT (Db) (green) and FMT(P) mice (red). Data are represented as the mean ± SD values. Data were analysed using one‐way ANOVA with Holm–Šídák's multiple‐comparisons test. Abx, antibiotics; FMT, faecal microbiota transplantation; LDA, linear discriminant analysis; ND, normal diet; PCA, principal component analysis.
