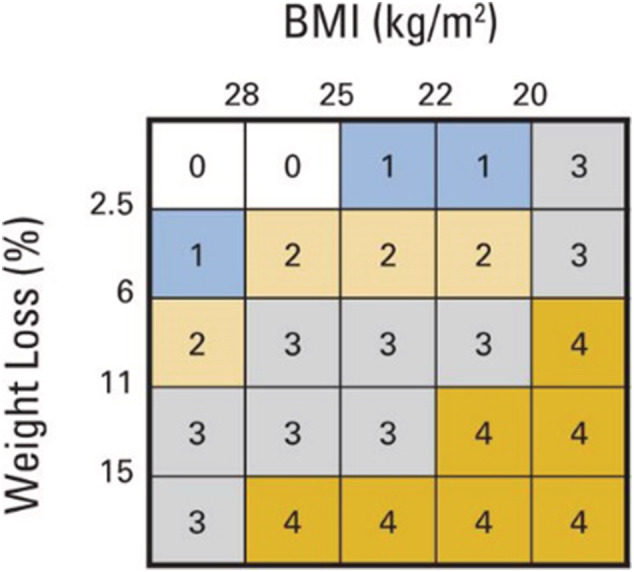
Figure 1.

Risk of reduced survival is a function of body mass index (BMI) and per cent weight loss (%WL). Panel represent a 5 × 5 matrix analysis of five categories of BMI and five categories of %WL. Reference categories are BMI ≥ 28.0 kg/m2 and weight stable ±2.4%. Different colours represent significant differences (P < .05) in median overall survival. BMI‐adjusted WL grading system (Grades 0–4) are shown.
