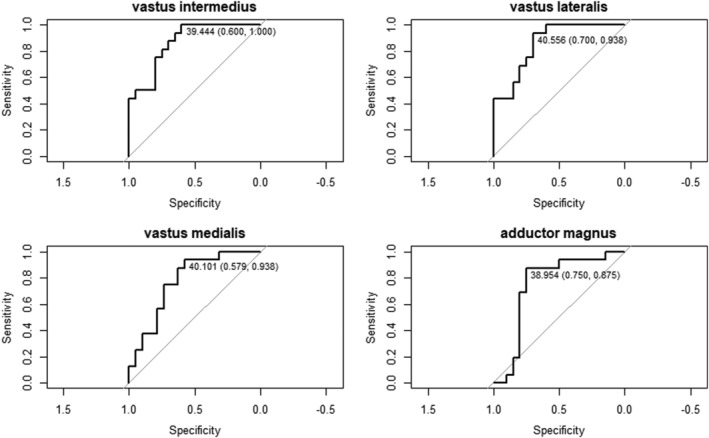
Figure 2.

Receiver operating characteristic curve of the sensitivity and specificity achieved by all possible T2H2O relaxation times. The area under the curve is listed for each plot. In each curve, the threshold with the highest specificity (with zero false positives) and the threshold with optimum sensitivity and specificity are listed.
