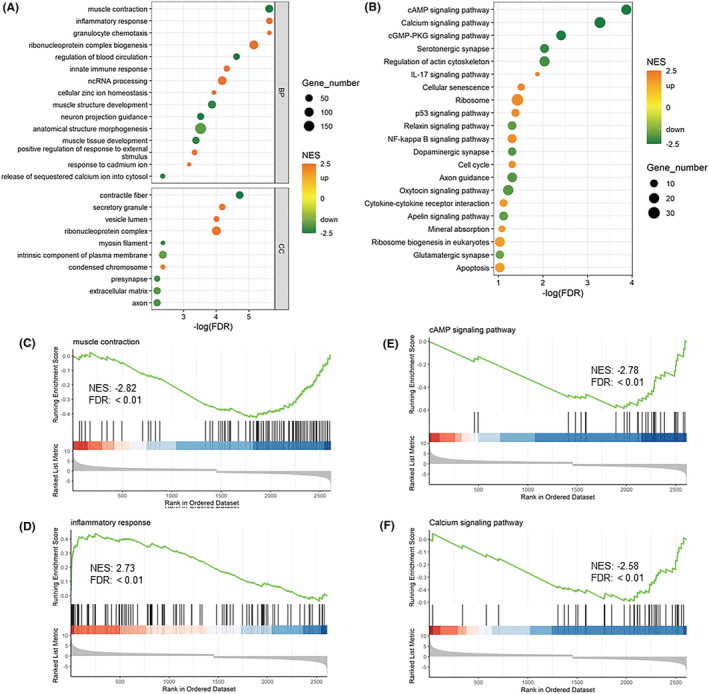
Figure 3.

Gene set enrichment analysis (GSEA) of differentially expressed genes (DEGs) from first biopsy versus control: (A) the top GObp and GOcc terms and (B) Kyoto Encyclopedia of Genes and Genomes (KEGG) terms were selected for demonstration; GSEA plot of the gene set enrichment analysis for (C) ‘muscle contraction (GObp)’, (D) ‘inflammatory response (GO bp)’, (E) ‘cAMP signaling pathway (KEGG)’ and (F) ‘calcium signaling pathway (KEGG)’. NES, normalized enrichment score
