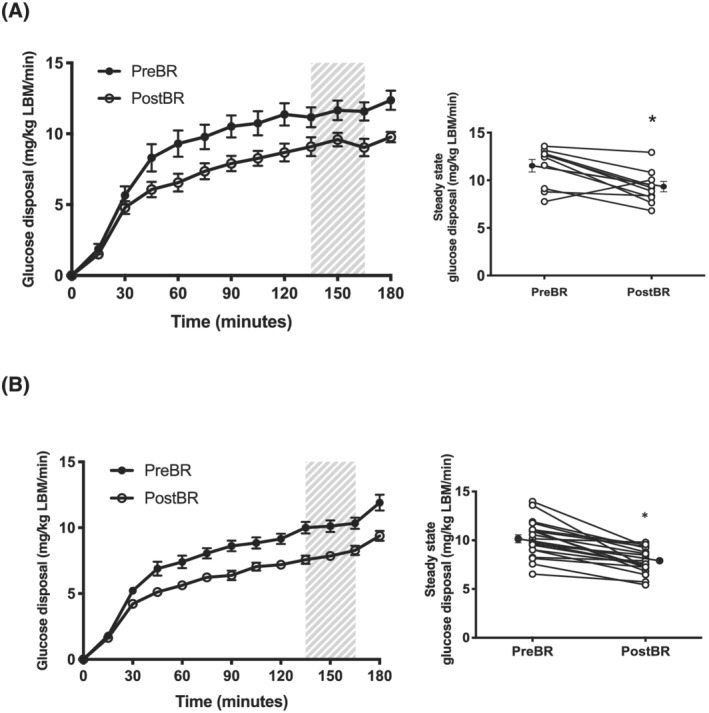
Figure 1.

Whole‐body glucose disposal. Whole‐body glucose disposal standardized to lean body mass (LBM) before bed rest (Pre‐BR) and after bed rest (Post‐BR) in (A) acute bed rest (n = 10) and (B) chronic bed rest (n = 20). Hatched shading shows steady‐state period with right hand graph depicting mean steady‐state whole‐body glucose disposal values (closed circles) and individual values (open circles). Data are mean ± SEM.
