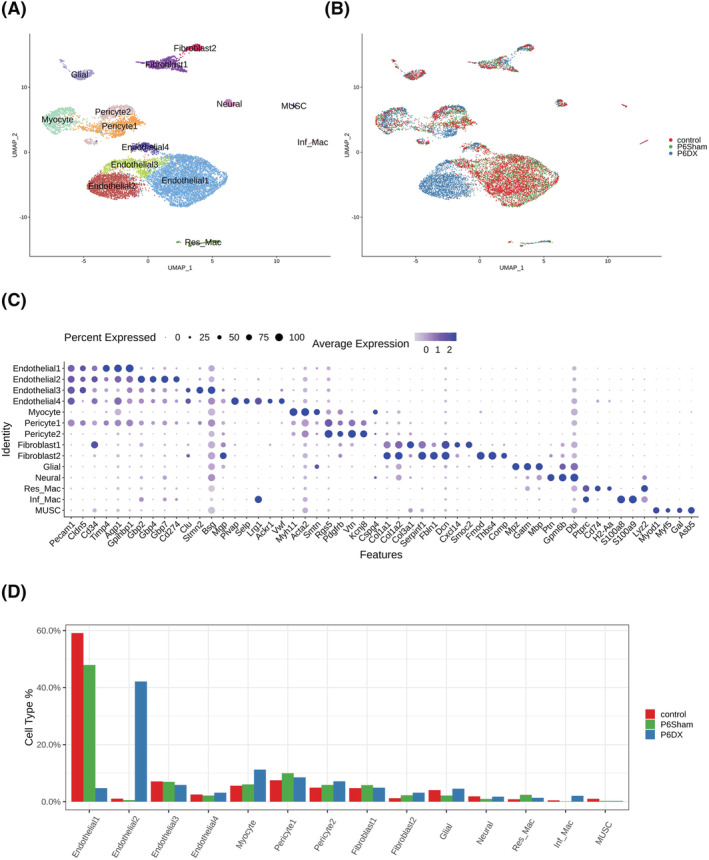
Figure 2.

Cell types identified from skeletal muscle biopsies by scRNA‐seq. (A) Cell atlas of skeletal muscle from sarcopenia and control mice presented by UMAP. Fourteen cell types are revealed from single‐cell transcriptome data. (B) Transcriptomic atlas coloured by experiment groups. Except endothelial1 and endothethlial2, different experiment groups largely overlap in different cell clusters. (C) Marker genes used to annotate cell types. Dot size represents % of cells of that cluster expressing the given gene, whereas colour indicates the expression level of that cluster. (D) Bar plot depicting the % of each cell type in each group; endothelial1 is enriched control and P6Sham groups, whereas endothelial2 is enriched in P6DX group.
