Figure 3.

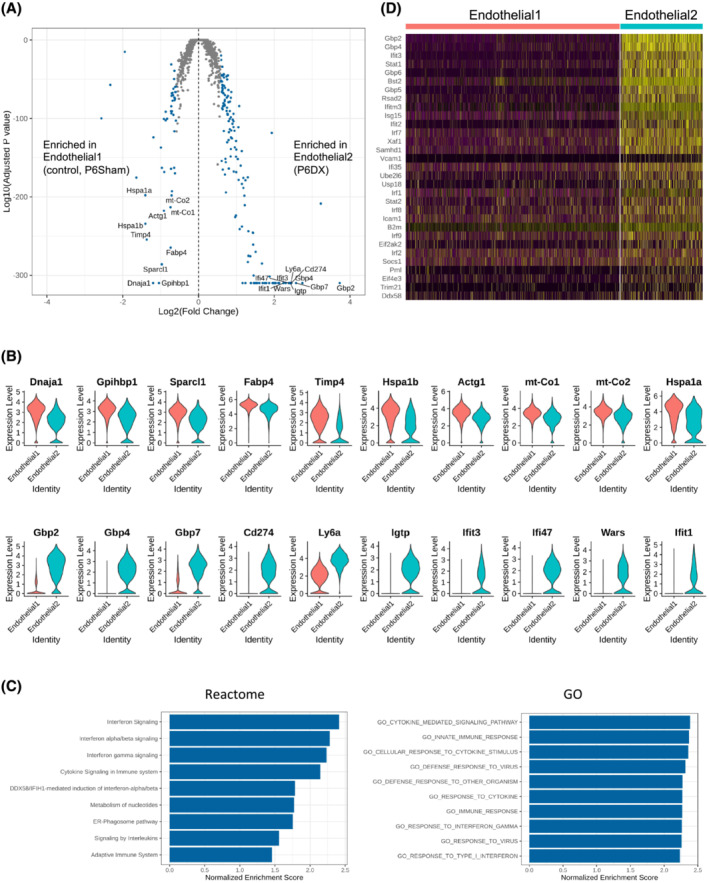
Distinct endothelial cell clusters between experiment groups. (A) Volcano plot showing differentially expressed genes between endothelial1 and endothelial2 cell clusters. Differentially expressed (DE) genes (|fold change| > 1.5 and adjusted P value < 0.05) are coloured blue. Top 10 DE genes by adjusted P value are labelled. (B) Violin plot to compare expression level of top 10 DE genes between endothelial1 and endothelial2. Upper panel is the top 10 genes enriched in endothelial1, and the bottom panel is the top 10 genes enriched in endothelial2. (C) Bar plot to present Reactome pathways (left) and GO terms (right) positively enriched in endothelial2 compared with endothelial1. (D) Heatmap to show the leading genes in interferon signalling pathway in endothelial1 and endothelial2.
