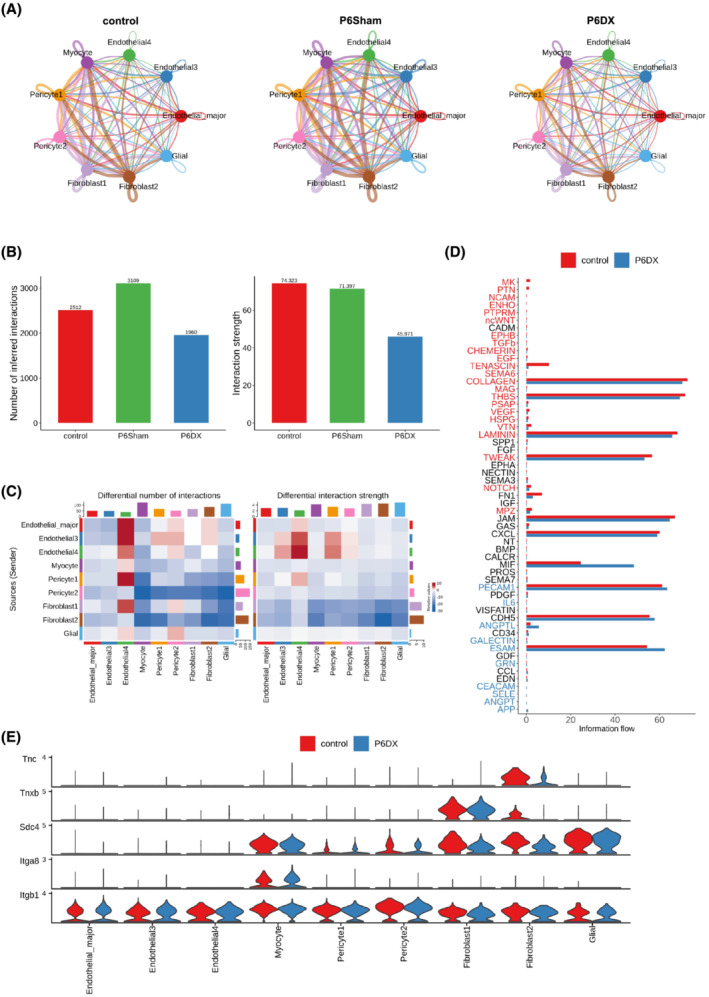
Figure 4.

Cell–cell interactions inferred from scRNA‐seq data. (A) Cell–cell interaction network among the major cell types in each experiment group. Edge width represents number of interactions between the two connecting cell types. P6DX group has a less dense network comparing to control and P6Sham groups. (B) Bar plot to compare number of interactions and interaction strength among the three groups. P6DX has fewest interactions and lowest interaction strength. (C) Heatmap to compare differential number of interactions and interaction strength between P6DX and control group. P6DX has fewer interactions and lower interaction strength in most cell type pairs. (D) Bar plot to compare the overall information flow of each signalling pathway. The signalling pathways coloured red are enriched in control, and these coloured blue are enriched in the P6DX. (E) Expression of signalling genes related to TENASCIN signalling pathway in control and P6DX groups.
