Figure 5.

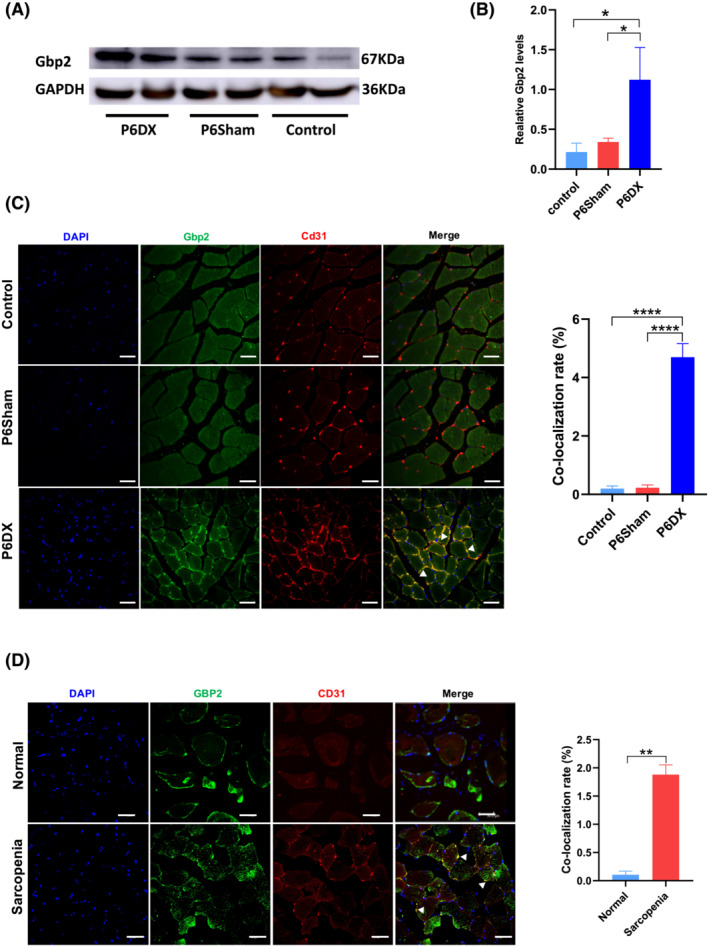
Gbp2 increased in mice and human sarcopenia muscle biopsies. (A) Western blot image to show that Gbp2 expression is increased in P6DX group. (B) Quantification of western blot results. Gbp2 expression is significantly higher than the other two groups (* indicates P value < 0.05). (C) Left: Immunofluorescence of mouse TA; expression of Gbp2 is identified in endothelial cells in the P6DX group (white arrows). Blue: DAPI, green: Gbp2, red: Cd31. Scale bar represents 20 μm. Right: Co‐localization rate of Cd31 and Gbp2 (**** indicates P value < 0.0001) (D) Left: Expression of GBP2 in human muscle tissue; expression of GBP2 in endothelial cells is observed in sarcopenia patients (white arrows). Blue: DAPI, green: GBP2, red: CD31. Scale bar represents 20 μm. Right: Co‐localization rate of CD31 and GBP2, (** indicates P value < 0.01).
