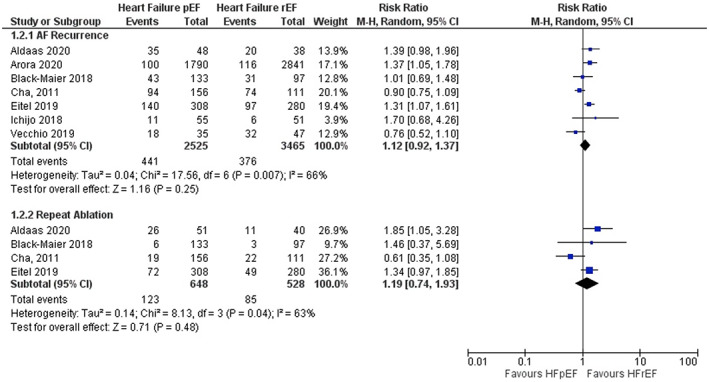
FIGURE 2.

Forest plot for primary outcomes comparing HFpEF and HFrEF. The pooled risk ratio with 95% confidence interval were calculated using a random effects model. Weight refers to the contribution of each study to the pooled estimate. Squares and horizontal lines denote the point estimate and 95% confidence interval for each study's risk ratio. The diamond signifies the pooled risk ratio; the diamond center denotes the point estimate, and the width denotes the 95% confidence interval.
