
Fig. 1. Characterization of nerve fibers and Schwann cells in the mouse subcutaneous adipose tissue.
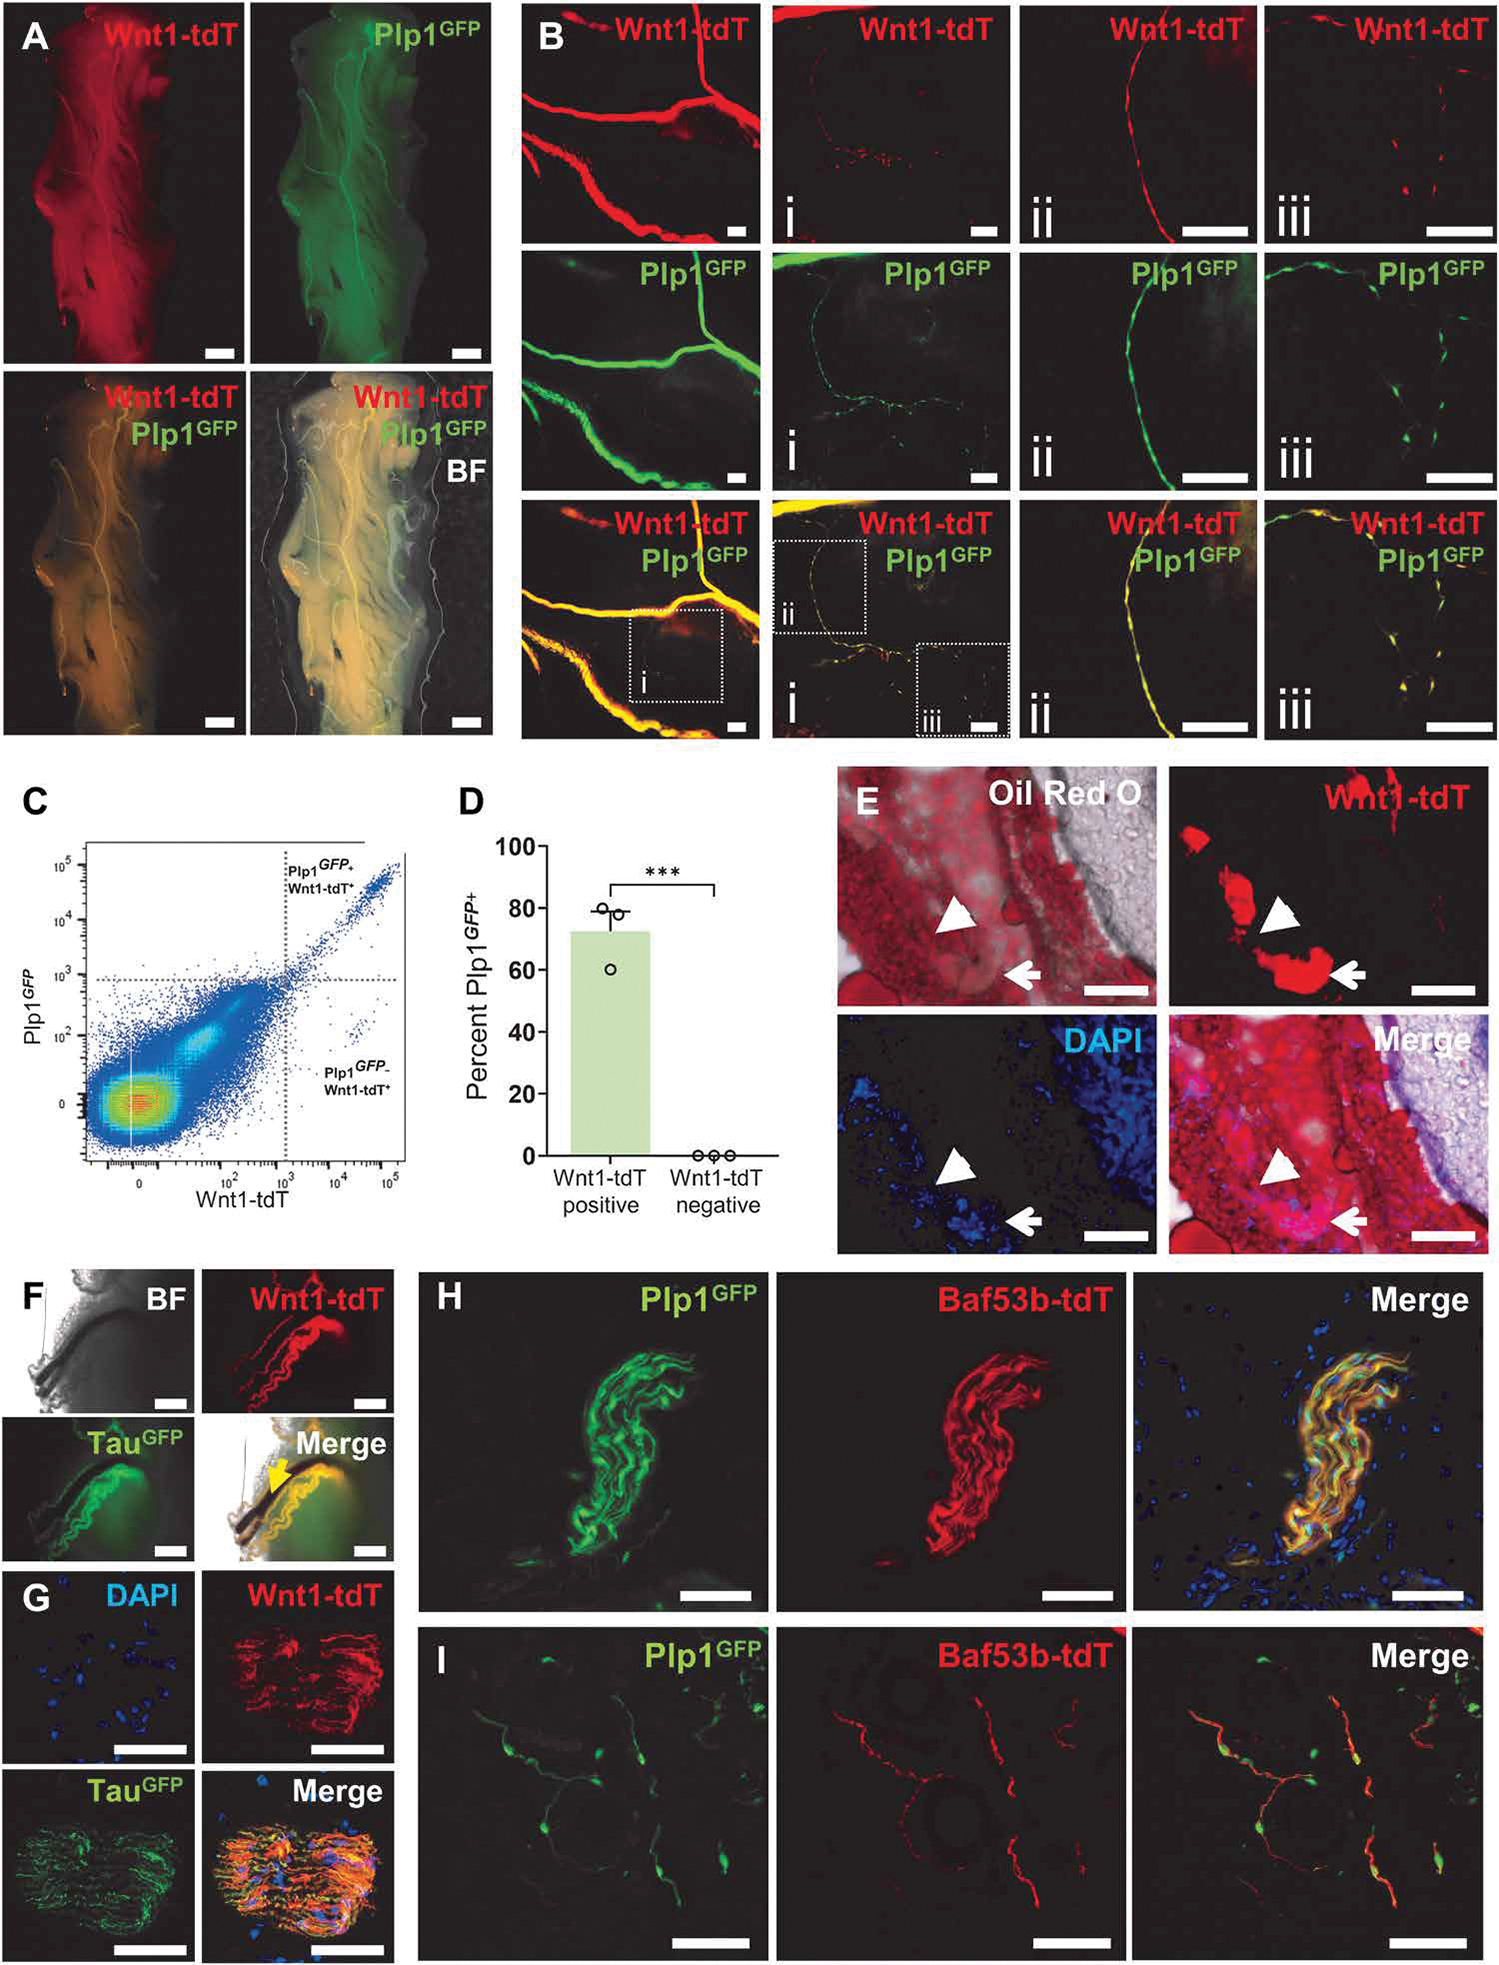
Representative low- (A) and high-magnification (B) images of whole-mount preparations of subcutaneous adipose tissue (SAT) from Plp1GFP;Wnt1-tdT mice. Scale bars, 1 mm (A), 200 μm (B), and 100 μm (Bi to Biii). (C) Representative dot plots of Wnt1-tdT and Plp1GFP expression in cells from digested SAT. (D) Quantification of the percentage of Plp1GFP-expressing cells within Wnt1-tdT+ and Wnt1-tdT− populations. n = 3 mice per group, unpaired t test, ***P < 0.001. (E) Oil Red O staining of lipids in cross sections of the SAT from Wnt-tdT mice. Open arrows indicate nerve fiber bundles (NFBs), and closed arrows denote NFB penetrating into the SAT. Scale bars, 100 μm. Representative images from TauGFP;Wnt1-tdT mice of whole-mount SAT with penetrating blood vessels (yellow arrow) (F) and cross sections of NFBs (G). Scale bars, 500 μm (F) and 50 μm (G). Representative images of NFBs (H) and individual nerve fiber processes (I) in cross sections of SAT from Plp1GFP;BAF53b-tdT mice. Scale bars, 50 μm.