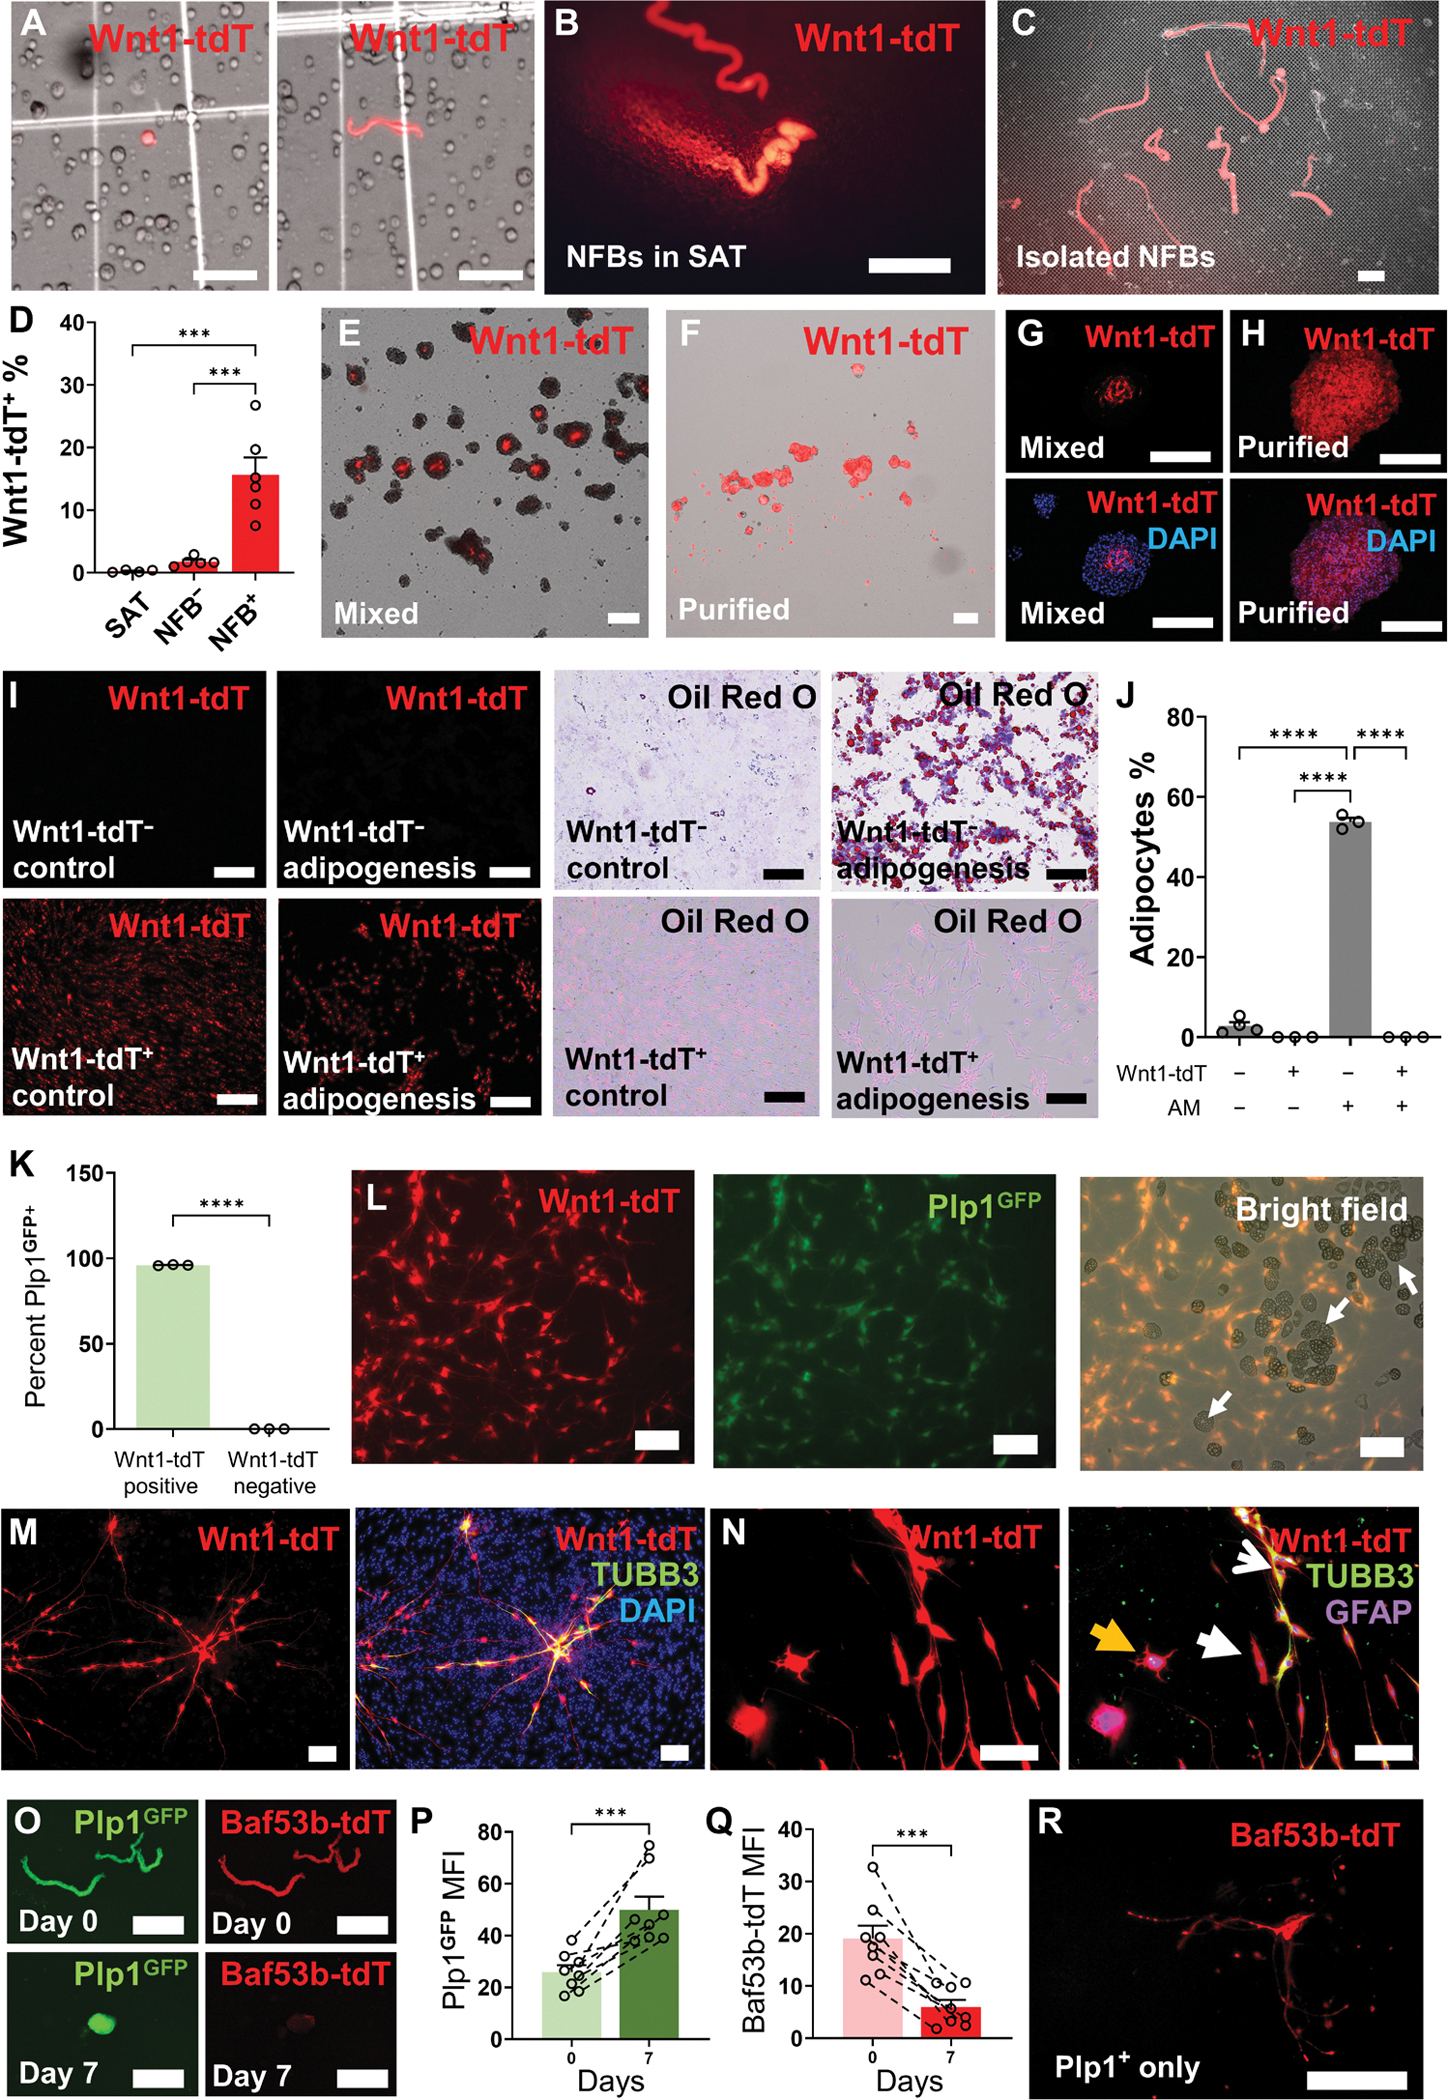
Fig. 2. SAT-NSCs originate from the NFBs of SAT in mice.

(A) Representative images of digested cells from the SAT of Wnt1-tdT reporter mice with Wnt1-tdT+ cells displaying spherical (left) and bipolar morphology (right). Scale bars, 50 μm. NFBs from Wnt1-tdT mice visualized in whole-mount SAT (B) and after enzymatic digestion of the SAT on a 40-μm cell strainer (C). Scale bars, 1 mm. (D) Percentage of Wnt1-tdT+ cells within filtered digested SAT (SAT) and cultured SAT-derived spheroids from filtered SAT without NFBs (NFB−) and unfiltered SAT containing NFBs (NFB+). SAT, n = 4; NFB−, n = 5; and NFB+, n = 6 mice per group, one-way ANOVA with Holm-Sidak multiple comparisons test, ***P < 0.001. Representative images of heterogeneous SAT-derived spheroids (Mixed) (E) and spheroids cultured from purified Wnt1-tdT+ cells (Purified) (F) under free-floating culture conditions. Scale bars, 200 μm (E) and 200 μm (F). (G and H) Wnt1-tdT expression in cross sections of mixed SAT-derived spheroids (G) and spheroids generated from purified Wnt1-tdT+ cells (H). Scale bars, 200 μm. (I) Representative images of adipogenesis assay using Wnt1-tdT− cells (top row) and Wnt1-tdT+ cells (bottom row) cultured in control or adipogenesis induction medium and stained for lipid vacuoles with Oil Red O. Scale bars, 200 μm. (J) Quantitative analysis of Oil Red O–positive adipocytes from Wnt1-tdT+ or Wnt1-tdT− cells cultured in adipogenesis medium (AM). One-way ANOVA with Holm-Sidak multiple comparisons test, ****P < 0.0001. (K) Quantification of the percentage of Plp1GFP-expressing cells within Wnt1-tdT+ and Wnt1-tdT− populations by flow cytometry. n = 3 mice per group, unpaired t test, ****P < 0.0001. (L) Representative images of adipogenesis assay conducted using heterogeneous cells from mixed SAT spheroids expressing Wnt1-tdT (left) Plp1GFP (middle) and bright-field images of adipocytes (right, white arrows). Scale bars, 200 μm. (M) Expression of Wnt1-tdT (left) and TUBB3 (right) in heterogeneous cultures from the adipose after neural differentiation. Scale bars, 200 μm. (N) Images of Wnt1-tdT expression (left) with immunohistochemistry for GFAP and TUBB3 (right) and merged images after differentiation. Arrows indicate TUBB3+ neurons (open white arrow), GFAP+ glial cells (yellow closed arrow), and cells expressing neither marker (white closed arrow). Scale bars, 200 μm. (O) Images of BAF53b-tdT and Plp1GFP expression in isolated NFBs from SAT (day 0) and SAT-NSC neurospheres during culture (day 7). Scale barss, 500 μm. Quantification of the mean fluorescence intensity (MFI) of PLP1GFP (P) and BAF53b-tdT (Q) in cultured NFBs. n = 8 NFBs per group, paired t test, ***P < 0.001. (R) Induction of BAF53b-tdT expression from Plp1GFP cells purified from SAT-derived spheroids. Scale bar, 250 μm.
