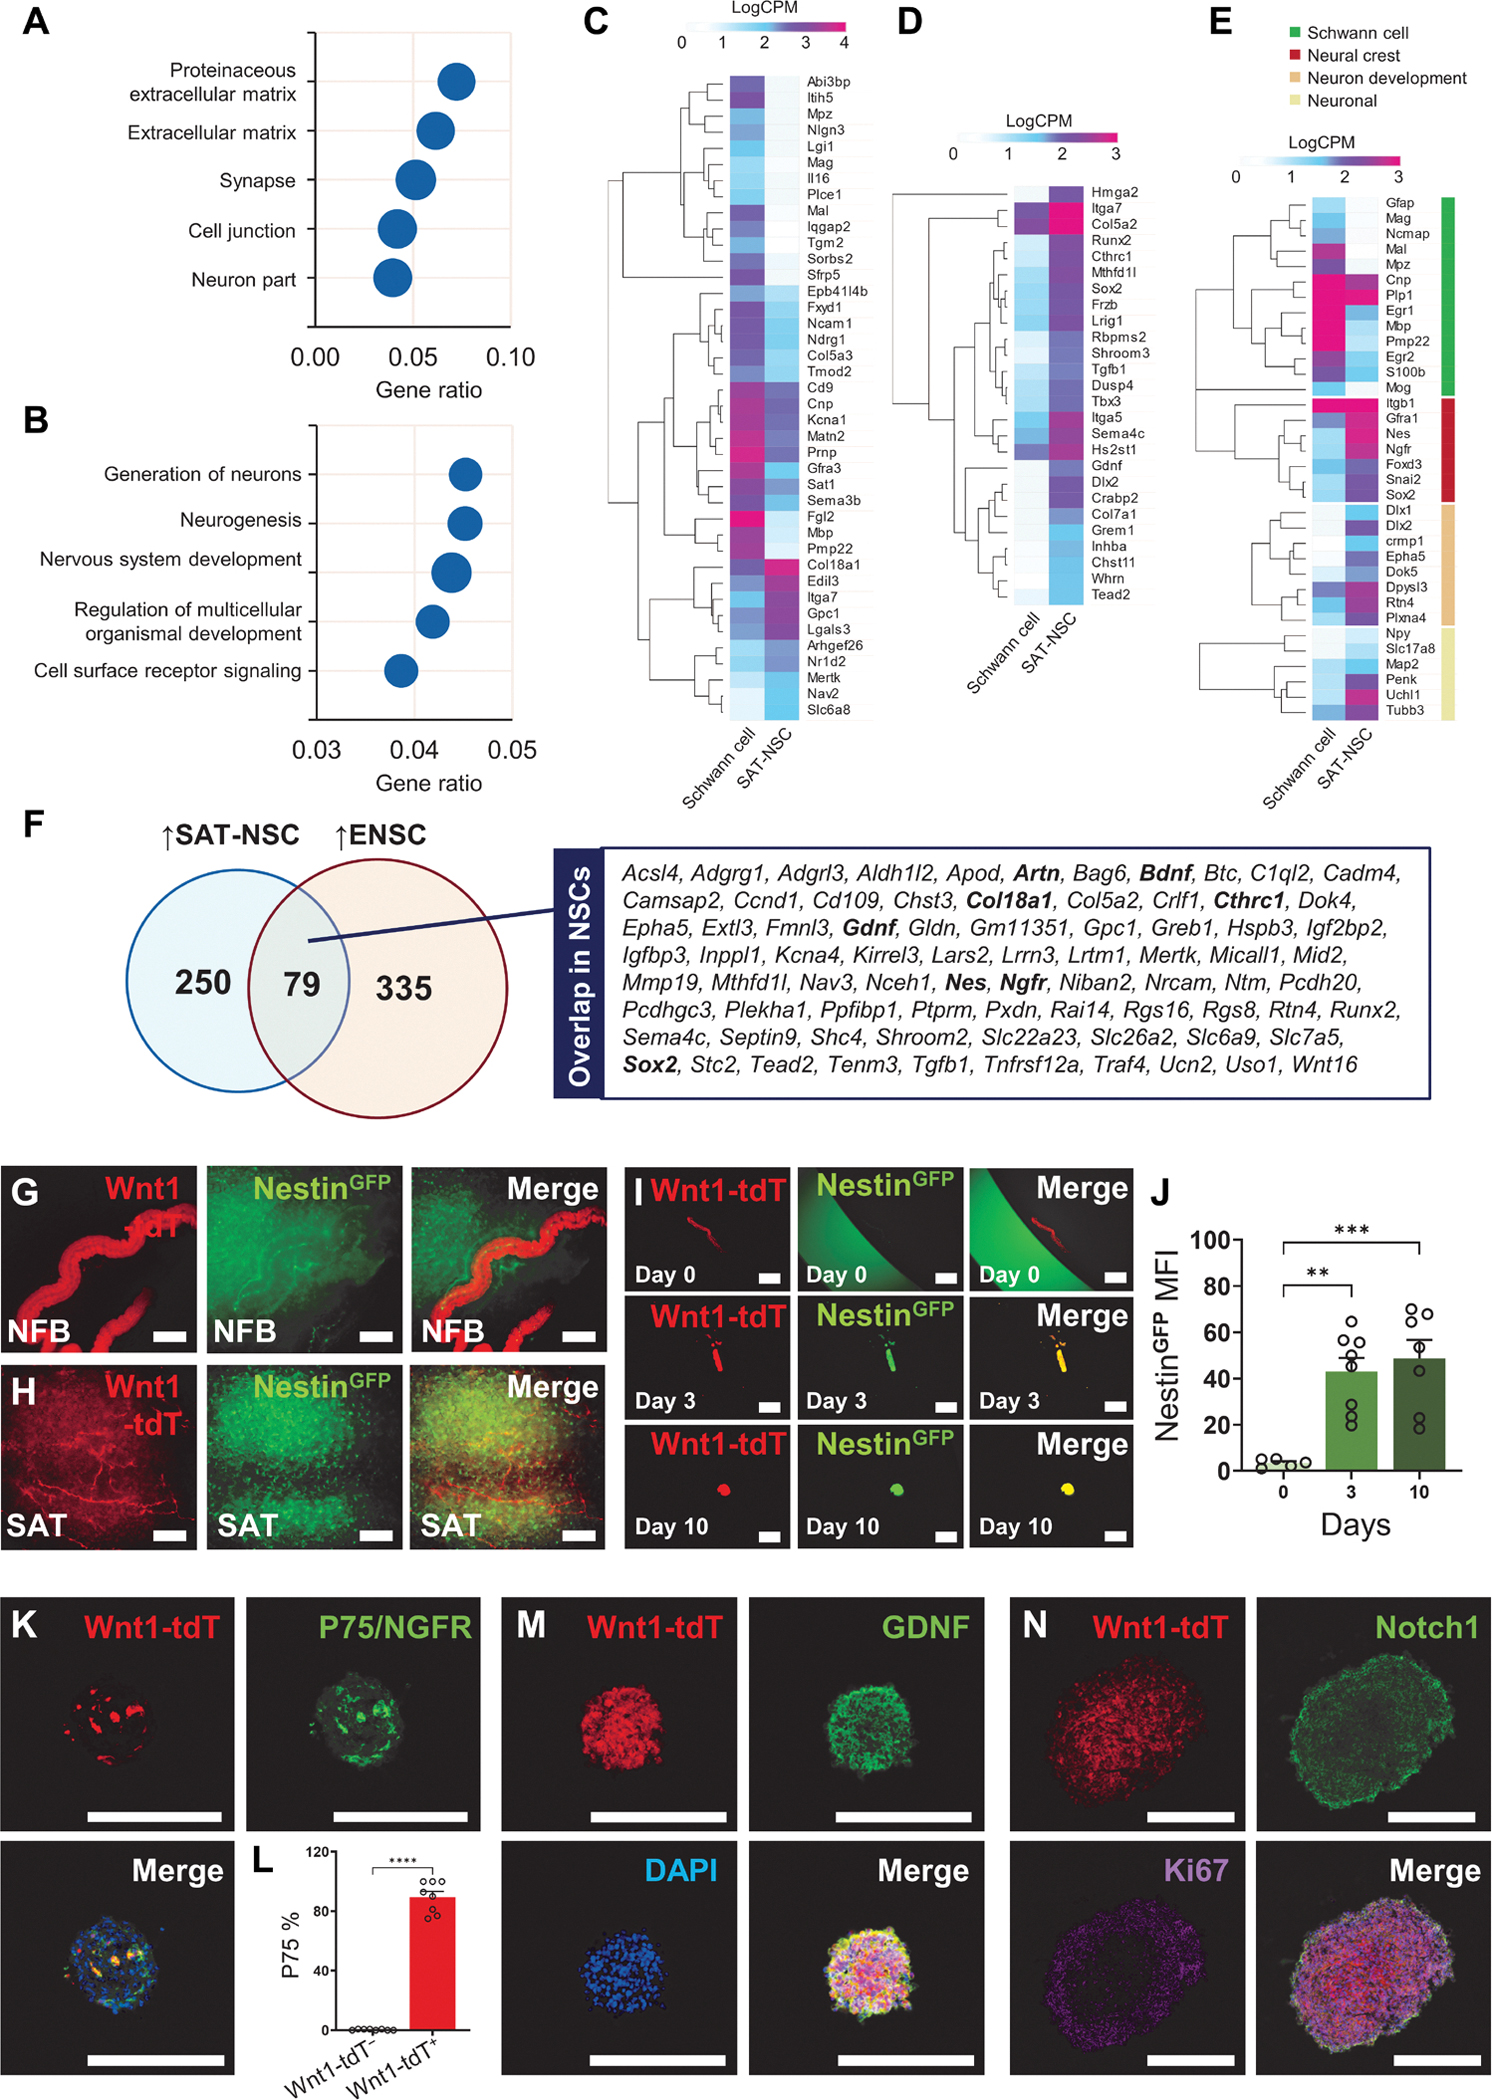
Fig. 3. Neural crest–derived Schwann cells from SAT acquire NSC properties in vitro.

Overrepresentation analysis of cellular components (A) and biological processes (B) for genes up-regulated in neurospheres generated from Wnt1-tdT+ cells compared with Wnt1-tdT+ cells obtained from primary SAT. (C to E) Heatmap representation of Schwann cell markers (C), Embryonic morphogenesis (D), as well as curated Schwann cell, neural crest stem cell, and neuronal genes (E) in Wnt1-tdT+ cells from SAT and cultured neurospheres (SAT-NSCs) visualized as LogCPM values. (F) Venn diagram of up-regulated DEGs common between SAT-NSCs and enteric neural stem cells (ENSCs). (G and H) Expression of Wnt1-tdT and NestinGFP in the NFB (G) and dispersed Wnt1-tdT+ Schwann cells (H) in the SAT. Scale bars, 200 μm. (I) NFBs from the digested SAT of NestinGFP; Wnt1-tdT cultured into spheroids over 10 days in free floating conditions. Scale bars, 500 μm. (J) Quantification of the MFI of NestinGFP in cultured NFBs. Day 0, n = 5; day 3, n = 8; day 10; n = 7 NFBs per group, one-way ANOVA with Holm-Sidak multiple comparisons test, **P < 0.01 and ***P < 0.001. (K) Representative images of Wnt1-tdT expression, immunoreactivity for P75/NGFR, and merged image with DAPI of heterogeneous SAT-derived spheroids. Scale bars, 200 μm. (L) Quantification of the percentage of P75-expressing cells in the Wnt1-tdT+ and Wnt1-tdT− populations of SAT-derived spheroids. n = 8 spheroids, unpaired t test, ****P < 0.0001. Representative images of Wnt1-tdT expression and immunohistochemistry for GDNF (M), Notch1, and Ki67 (N) in neurospheres generated from purified Wnt1-tdT+ cells. Scale bars, 200 μm.
