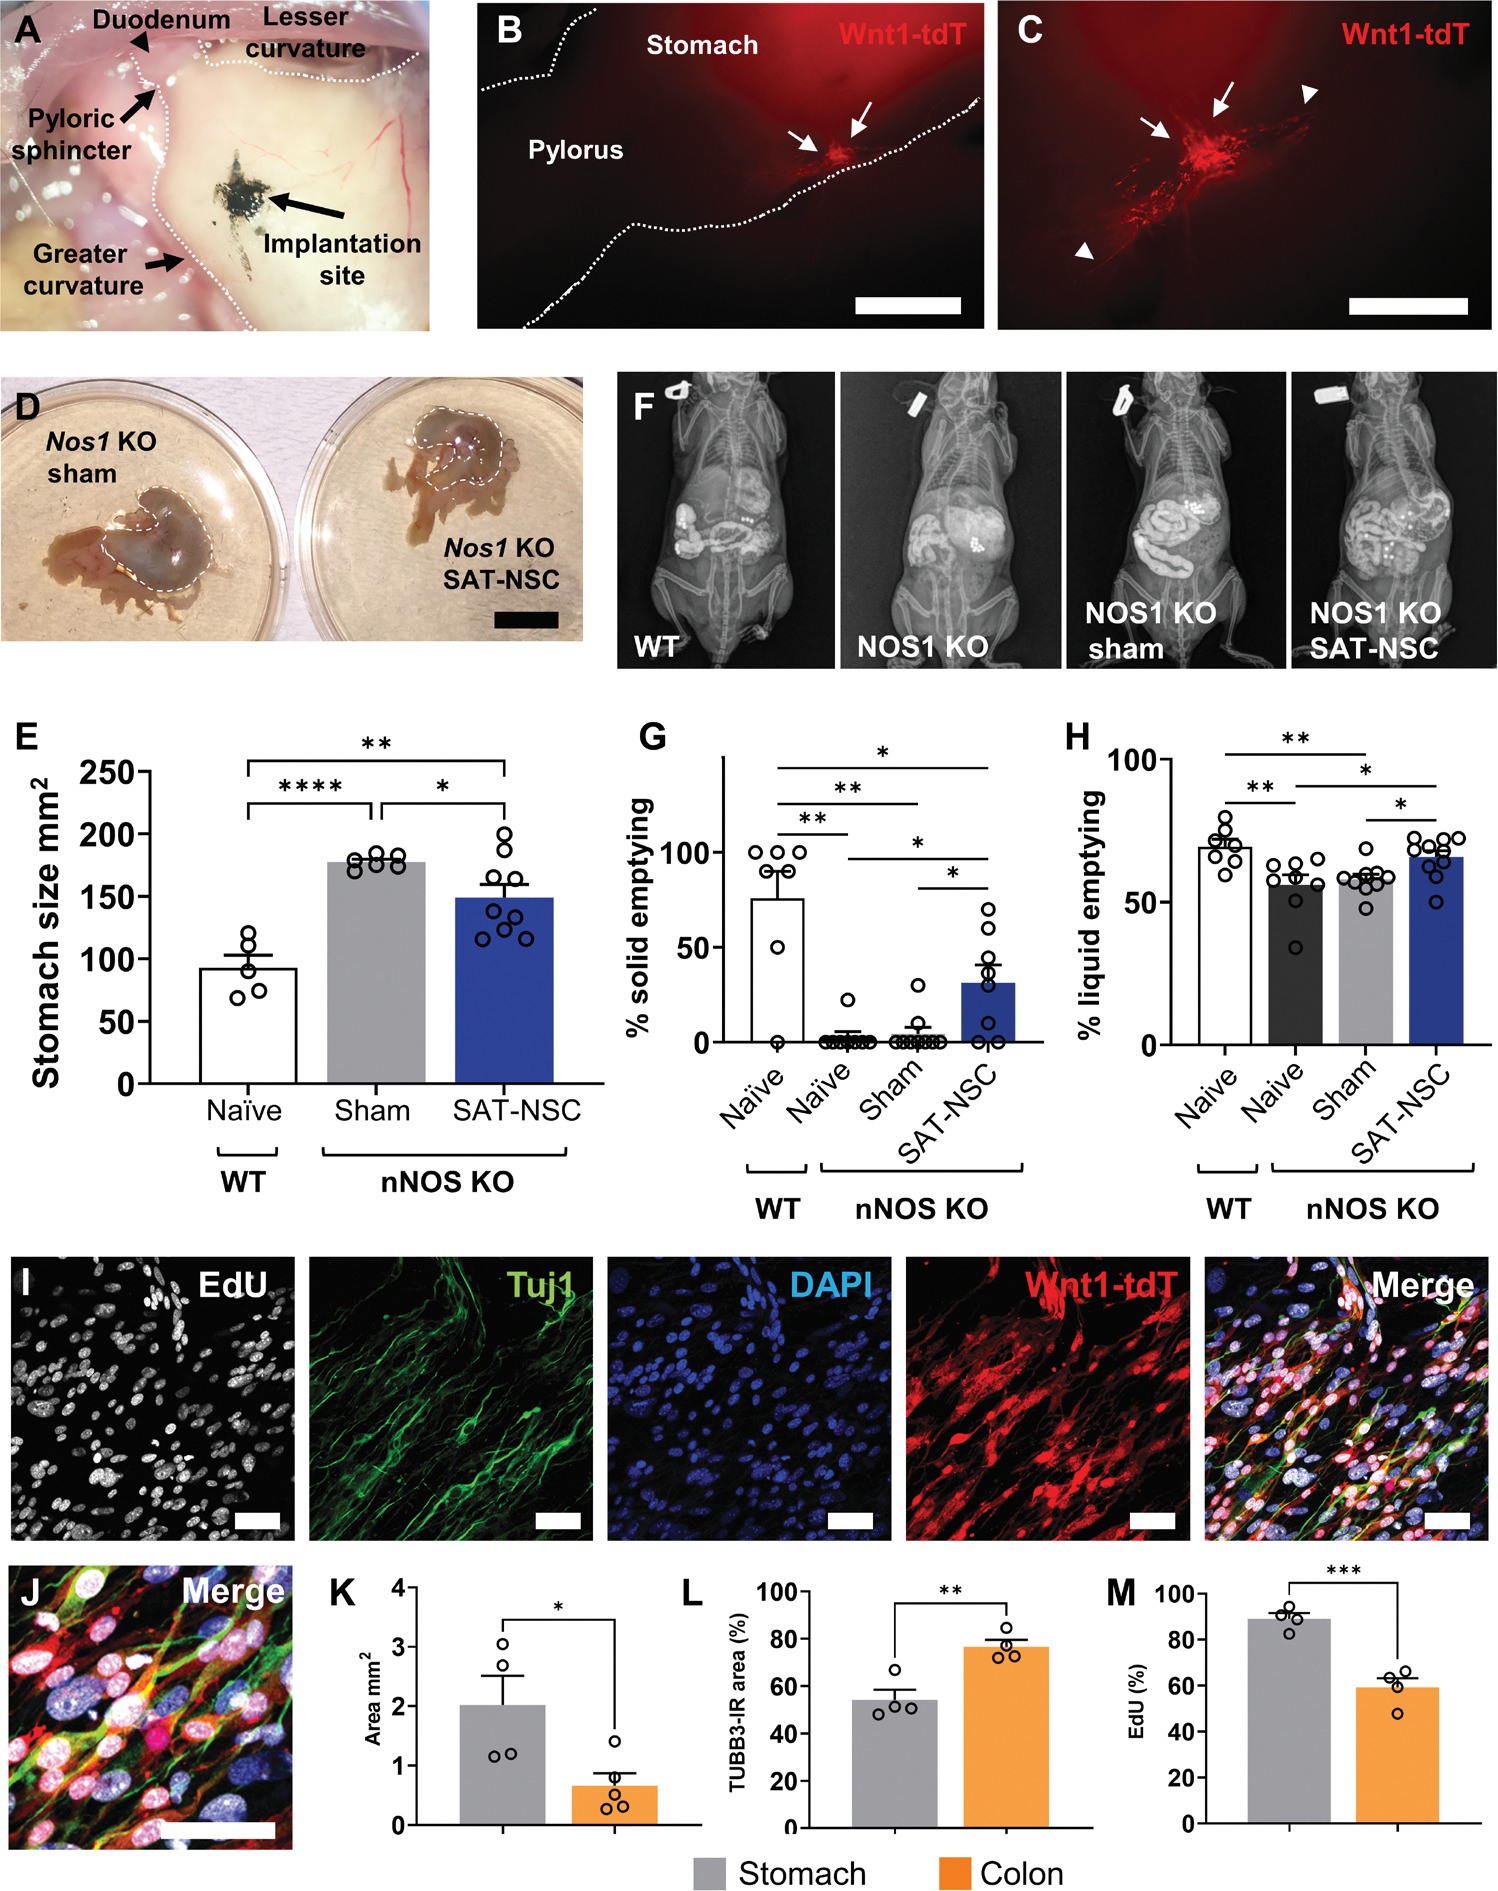
Fig. 5. Transplantation of SAT-NSCs alleviates gastroparesis in nNOS KO mice.

(A) Implantation of SAT-NSCs proximal to the pylorus in the stomach of the nNOS−/− mouse model of gastroparesis. (B) Engraftment of Wnt1-tdT+ SAT-NSCs (arrows) into the stomach. Scale bar, 2 mm. (C) SAT-NSCs with projecting nerve fibers (arrow heads) in the stomach. Scale bar, 1 mm. (D) Representative images of stomachs from nNOS−/− mice receiving implantation of SAT-NSCs and sham surgery and implantation controls. Scale bar, 1 cm. (E) Quantification of stomach sizes as area in mm2. One-way ANOVA with Holm-Sidak multiple comparisons test, *P < 0.05, **P < 0.01, and ****P < 0.0001. Naïve wild-type (WT) mice, n = 5; sham nNOS−/−, n = 6; and SAT-NSC–treated nNOS−/−, n = 9 mice group. (F) Representative images of radiographic visualization of gavaged radiopaque beads and liquid barium in the gastrointestinal tract of naïve WT, nNOS−/−, nNOS−/− mice with sham surgery, and nNOS−/− mice with SAT-NSC transplantation (left to right). (G) Quantification of gastric emptying of solid materials (beads). Brown-Forsythe ANOVA test with Welch’s corrected multiple comparisons t test, *P < 0.05 and **P < 0.01. Naïve WT mice, n = 7; naïve nNOS−/− mice, n = 8; sham nNOS−/−, n = 9; and SAT-NSC–treated nNOS−/−, n = 8 mice per group. (H) Quantification of gastric emptying of liquid materials (barium). Brown-Forsythe ANOVA test with Welch’s corrected multiple comparisons t test, *P < 0.05 and **P < 0.01. Naïve WT mice, n = 7; naïve nNOS−/− mice, n = 8; sham nNOS−/−, n = 9; and SAT-NSC–treated nNOS−/−, n = 8 mice per group. (I and J) Representative single confocal slice images of EdU incorporation in proliferating cells, the neuronal marker TUBB3 (Tuj1), DAPI, Wnt1-tdT, and merged images (I, left to right, and J, magnified image) in the muscularis of the stomach ex vivo after Wnt1-tdT+ SAT-NSC implantation for 7 days. Scale bars, 50 μm. (K to M) Quantification of the total area (square millimeter) covered by migrating Wnt1-tdT+ SAT-NSCs (K), percentage of the TUBB3-immunoreactivity (IR) colocalization area with Wnt1-tdT+ SAT-NSCs (L), and the percentage of proliferating EdU+ SAT-NSCs (M) after 7 days in the stomach and colon. Unpaired t test, *P < 0.05, **P < 0.01, ***P < 0.001, n = 4 mice per group.
