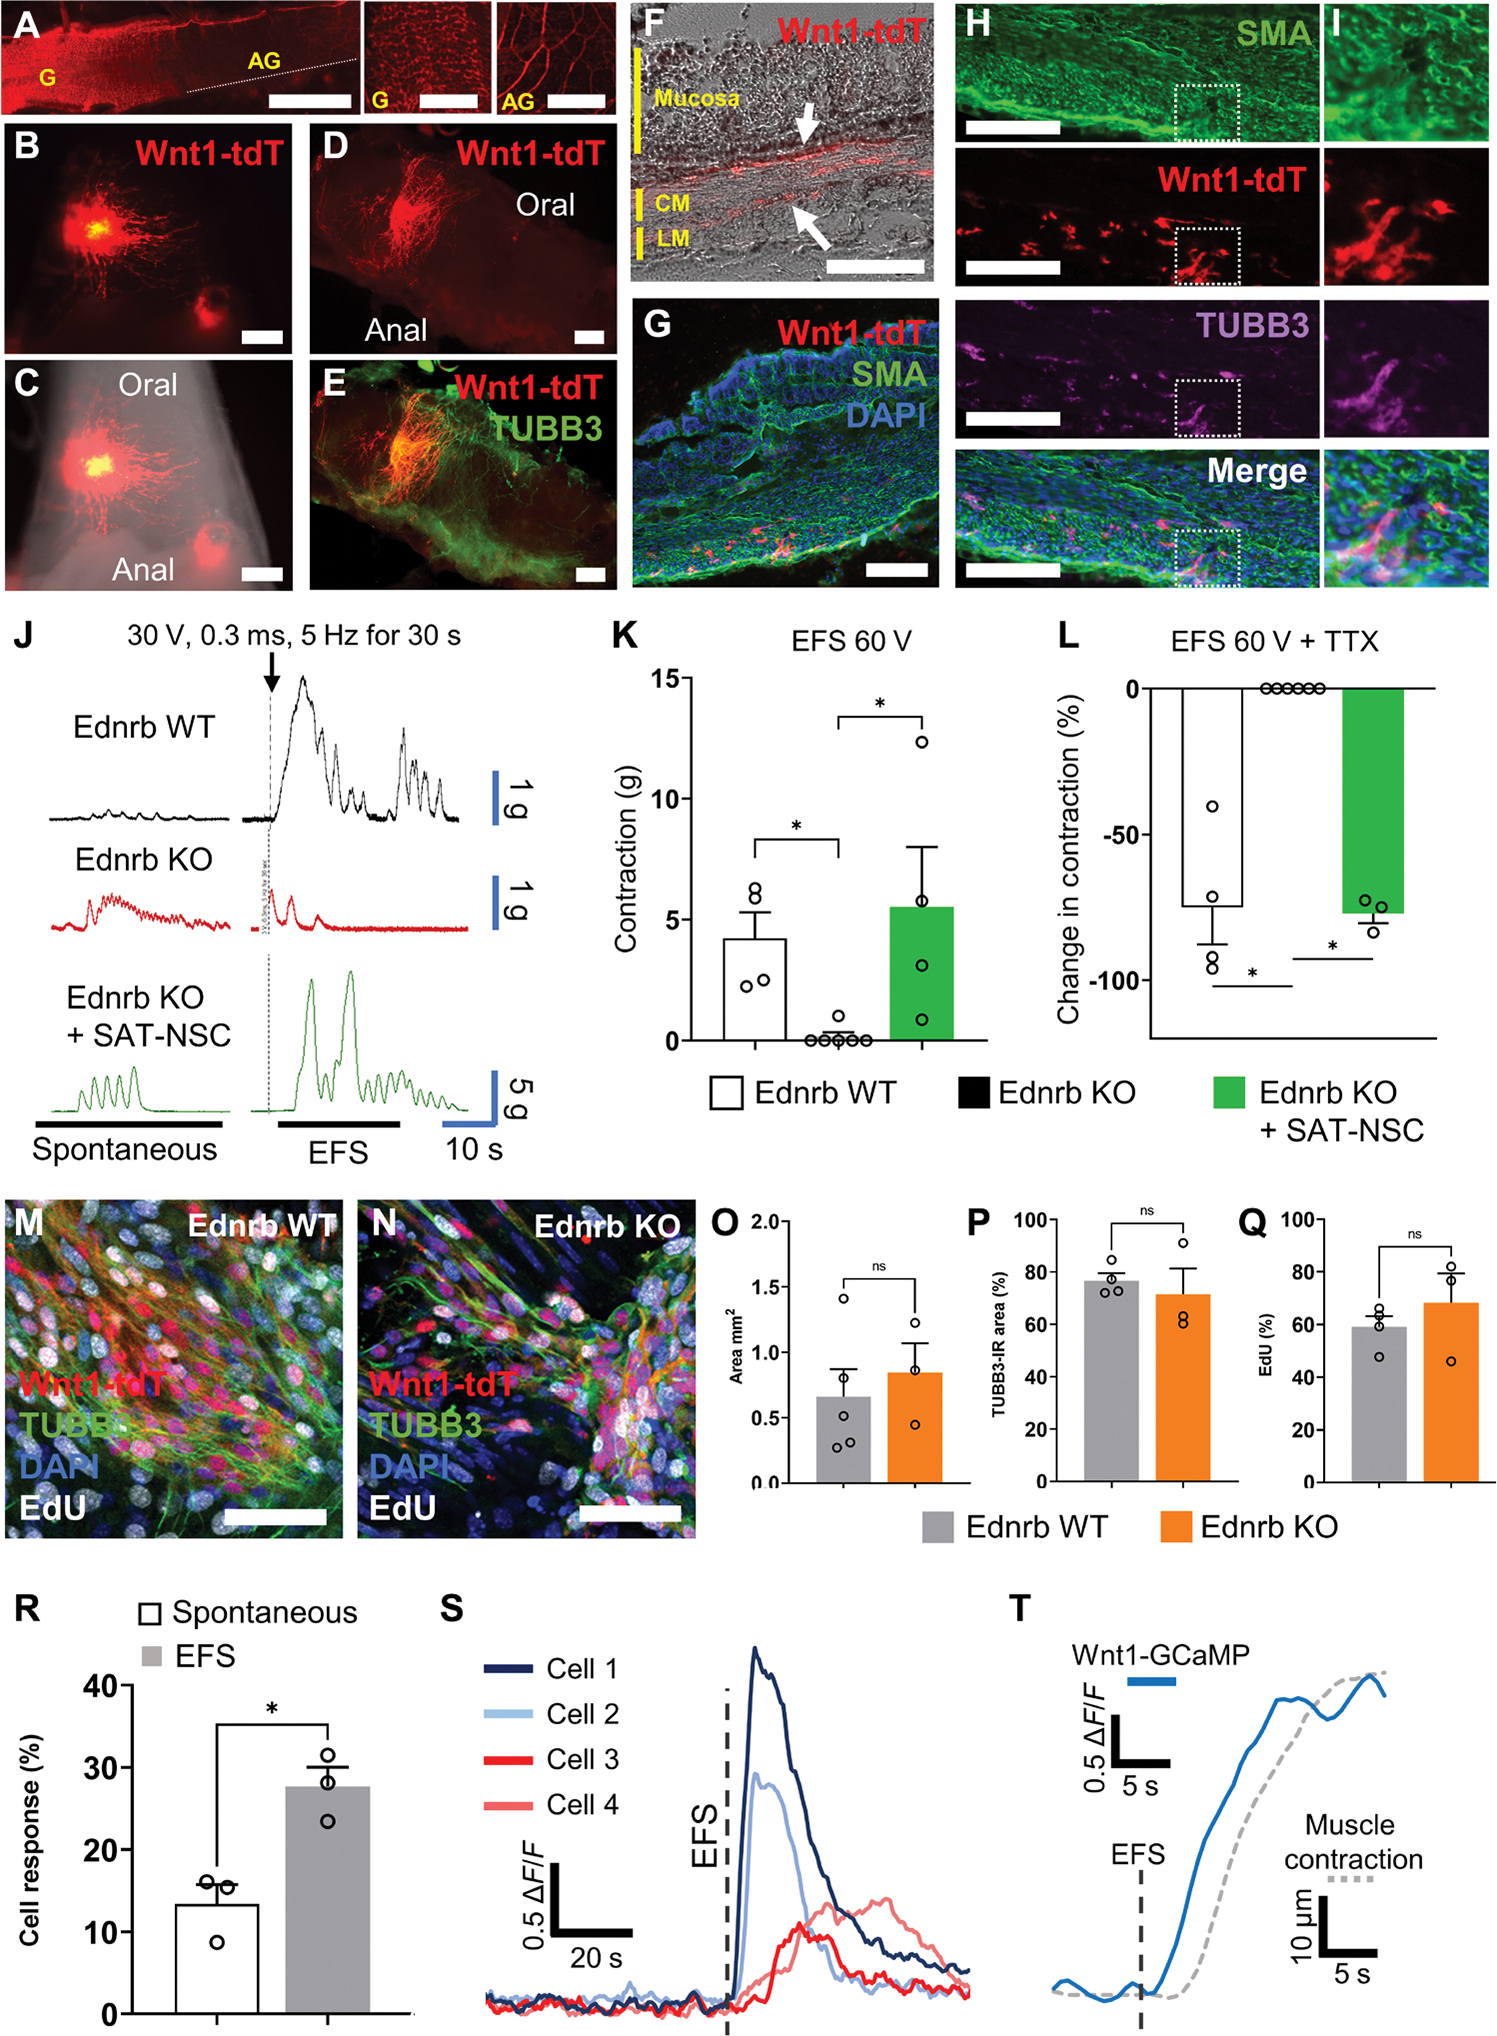
Fig. 6. SAT-NSCs restore muscle contraction in intestinal aganglionosis.

(A) Representative images of the nervous system in the colon of Wnt1-tdT;Ednrb KO mice. Scale bars, 4 mm. The proximal colon is ganglionated (yellow G) with intrinsic neurons, whereas the aganglionic (yellow AG) segment is observed from the mid colon to the rectum and contains only hypertrophic nerve fibers of extrinsic origin. Scale bars, 1 mm. (B and C) Expression of Wnt1-tdT in SAT-NSCs (B) 2 weeks after transplantation to the colorectum (C) of Ednrb−/− with colorectal aganglionosis at P6. Scale bars, 0.5 mm. (D and E) Images of whole-mount preparations of the Ednrb KO colon with transplanted Wnt1-tdT+ SAT-NSCs (D) and immunolabeled for the neuronal marker TUBB3 (E). Scale bars, 300 μm. (F) Cross section of the transplanted Ednrb KO colon in bright field. Arrows indicate transplanted Wnt1-tdT+ cells located between the mucosa and circular muscle (CM) or the CM and longitudinal muscle (LM). Scale bar, 200 μm. (G) Cross section of the SAT-NSC transplanted Ednrb KO colon labeled for alpha smooth muscle actin (SMA) and stained with DAPI. Scale bar, 200 μm. (H and I) Representative images of the muscularis (SMA) in cross sections of the SAT-NSC transplanted Ednrb KO colon labeled with the neuronal marker TUBB3 (H, low magnification; I, high magnification). Scale bars, 200 μm. (J) Representative traces of colonic contractile force in Ednrb+/+ (Ednrb WT, black), Ednrb−/− (Ednrb KO, red), and Ednrb−/− mice with SAT-NSC neurosphere implantation (Ednrb KO + SAT-NSC, green) before (spontaneous) and directly after EFS. (K) Quantification of the change in contractile force (grams) from baseline after EFS stimulation in Ednrb WT, Ednrb KO, and Edrnb KO mice after SAT-NSC transplants. Ednrb KO, n = 6; Ednrb WT and Edrnb KO + SAT-NSC, n = 4 mice per group. Kruskal-Wallis nonparametric ANOVA with Dunn’s multiple comparisons test, *P < 0.05. (L) Quantification of TTX-sensitive (neural) contributions to the EFS-induced contractile response. Ednrb WT, n = 4; Ednrb KO, n = 6; and Edrnb KO + SAT-NSC, n = 3 mice per group. Kruskal-Wallis nonparametric ANOVA with Dunn’s multiple comparisons test, *P < 0.05. (M and N) Representative single confocal slice images of EdU incorporation in proliferating cells (EdU) the neuronal marker TUBB3, DAPI, and Wnt1-tdT in the muscularis of the ganglionated Ednrb WT (M) and aganglionic Ednrb KO (N) distal colon after Wnt1-tdT+ SAT-NSC implantation for 7 days. Scale bars, 50 μm. (O to Q) Quantification of the total area (square millimeter) covered by migrating Wnt1-tdT+ SAT-NSCs (O), percentage of the TUBB3-immunoreactivity (IR) colocalization area with Wnt1-tdT+ SAT-NSCs (P), and the percentage of proliferating EdU+ SAT-NSCs (Q) after 7 days in the ganglionated (Ednrb WT) and aganglionic (Ednrb KO) colon. Ednrb WT, n = 4 and Ednrb KO, n = 3 mice per group, unpaired t test, NS, not significant. (R) Quantification of the number of spontaneous and EFS-invoked calcium responses in SAT-NSCs transplanted to the aganglionic colon. n = 3 per group, Unpaired t test, *P < 0.05. (S) Representative traces of calcium transients (ΔF/F0) in transplanted SAT-NSCs in the aganglionic colon. Red traces denote neuronal-like responses to EFS, and blue traces denote glial-like secondary responses. (T) Representative traces of global calcium transients (ΔF/F0) from transplanted SAT-NSCs (solid blue) and smooth muscle contraction (dotted gray) in response to EFS in the aganglionic colon.
