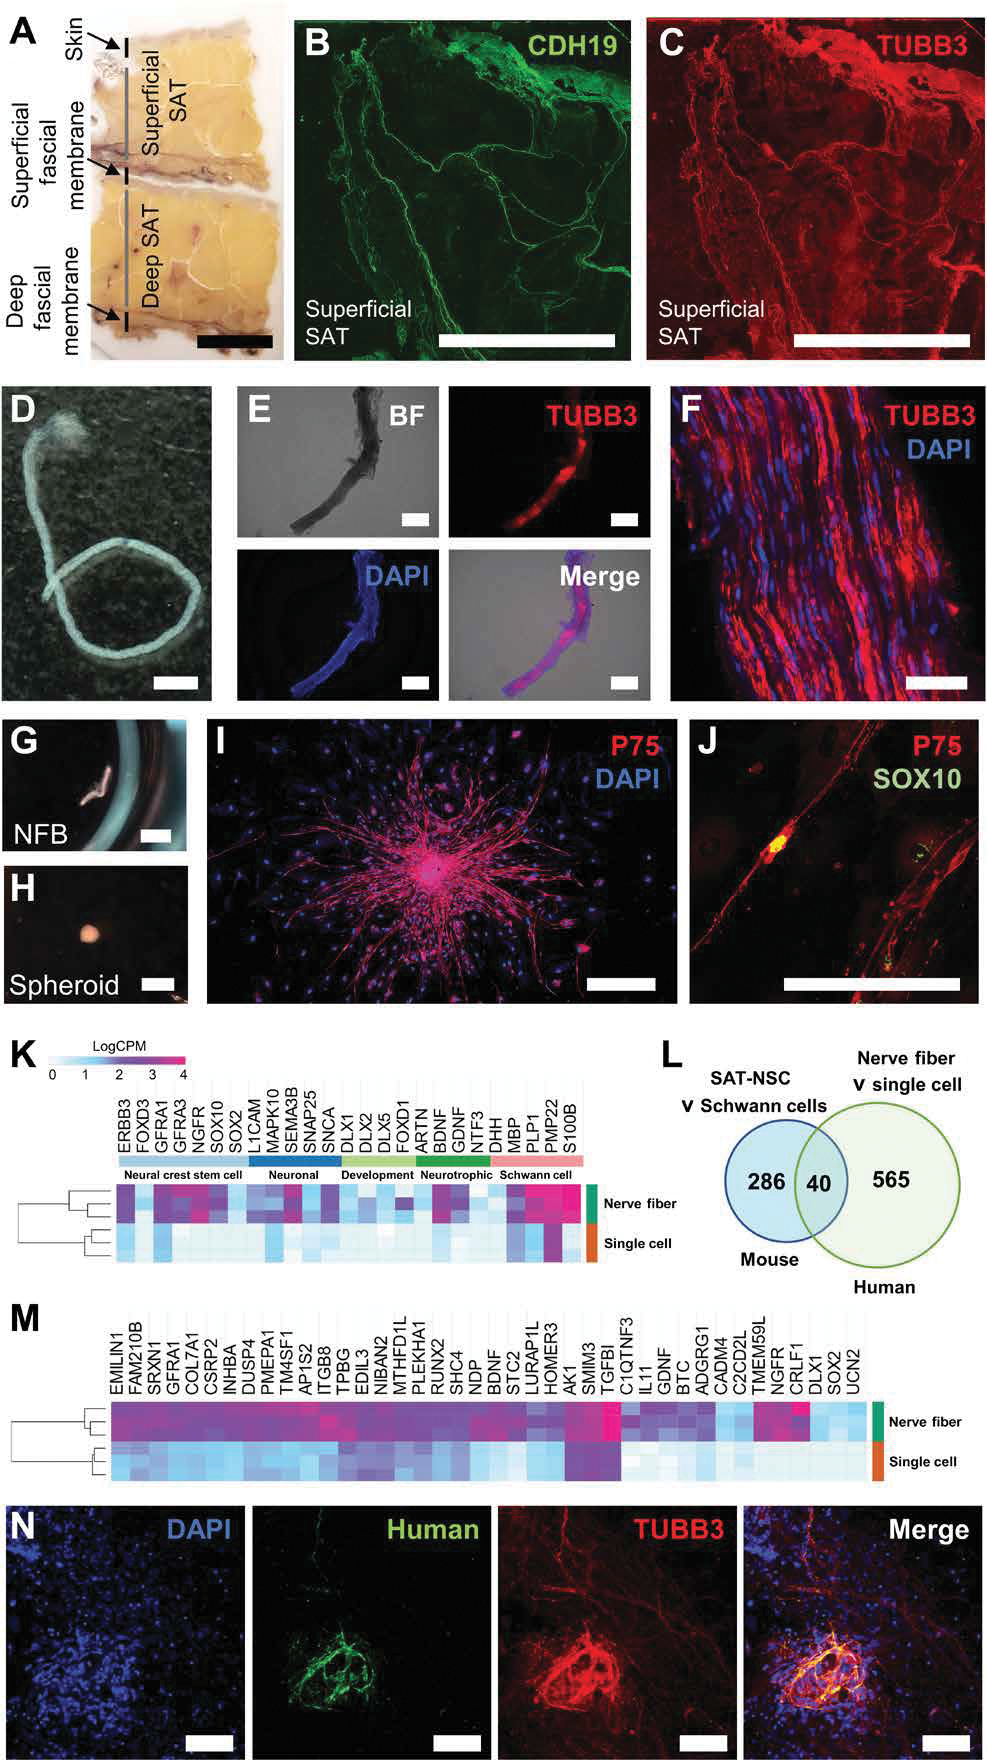
Fig. 7. Human adult SAT is a source of SAT-NSCs derived from NFBs.

(A) Sectional slice of resected human SAT. Scale bar, 1 cm. (B and C) Immunohistochemistry of the Schwann cell marker, CDH19 (B), and nerve fiber marker, TUBB3 (C), in cross sections of the superficial SAT. Scale bars, 1 cm. (D) Representative image of NFB isolated from digested SAT. Scale bar, 2 mm. (E) Representative images of bright field (top left), TUBB3 immunohistochemistry (top right), DAPI (bottom left), and merged images (bottom right) in a whole-mount NFB from the SAT. Scale bars, 500 μm. (F) High-magnification image of whole-mount NFB containing nucleated cells (DAPI) and expressing TUBB3. Scale bar, 50 μm. (G and H) Representative images of human SAT-derived NFB before (G; scale bar, 2 mm) and after culture (H; scale bar, 1 mm) in free floating conditions. (I and J) Representative images of immunohistochemical labeling for P75 (I; scale bar, 500 μm) and SOX10 (J; scale bar, 200 μm) in SAT NFB–derived spheroids cultured on fibronectin. (K) Heatmap representation of curated neural crest stem cell, neuronal, neural development, neurotrophic, and Schwann cell genes in SAT NFB–derived spheroids compared to filtered single-cell suspension–derived spheroids visualized as LogCPM values. (L) Venn diagram of up-regulated genes common between human SAT NFB–derived spheroids compared to single-cell suspensions and mouse SAT-NSCs compared to Schwann cells. (M) Heatmap representation of common genes in SAT NFB–derived spheroids compared to filtered single-cell suspension–derived spheroids visualized as LogCPM values. (N) Representative image of human SAT NFB–derived cells labeled with TUBB3 after ex vivo transplantation. Scale bars, 200 μm.
