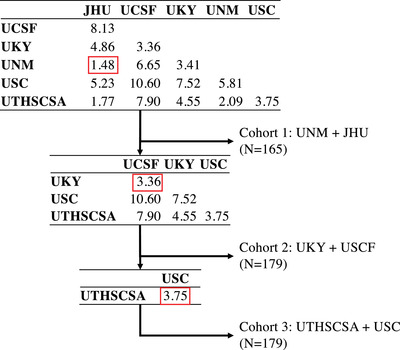
FIGURE 1.

Flowchart describing stepwise sub‐cohort grouping. Tables indicate Euclidian distance between each pair of MarkVCID sites based on average age, education, proportion of female, and proportion of individuals with hypertension, diabetes, and smoking history. At each step (top to bottom), the lowest pairwise distance was used for grouping corresponding sites, which were in turn removed from the table
