FIGURE 3.

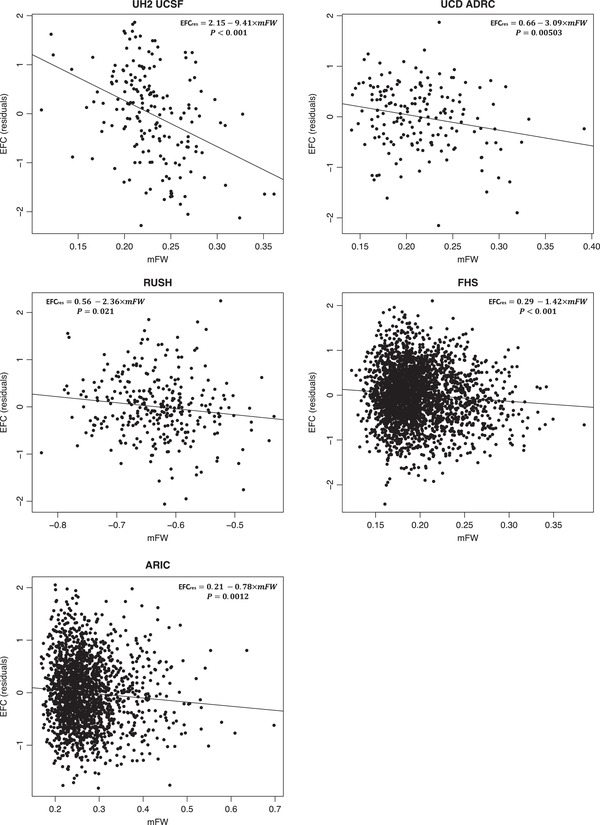
Cross‐sectional association between mFW and EFC scores (residualized against age, sex, and education, [EFCres]) in legacy cohorts. RUSH used log10‐transformed FW measures to normalize distribution

Cross‐sectional association between mFW and EFC scores (residualized against age, sex, and education, [EFCres]) in legacy cohorts. RUSH used log10‐transformed FW measures to normalize distribution