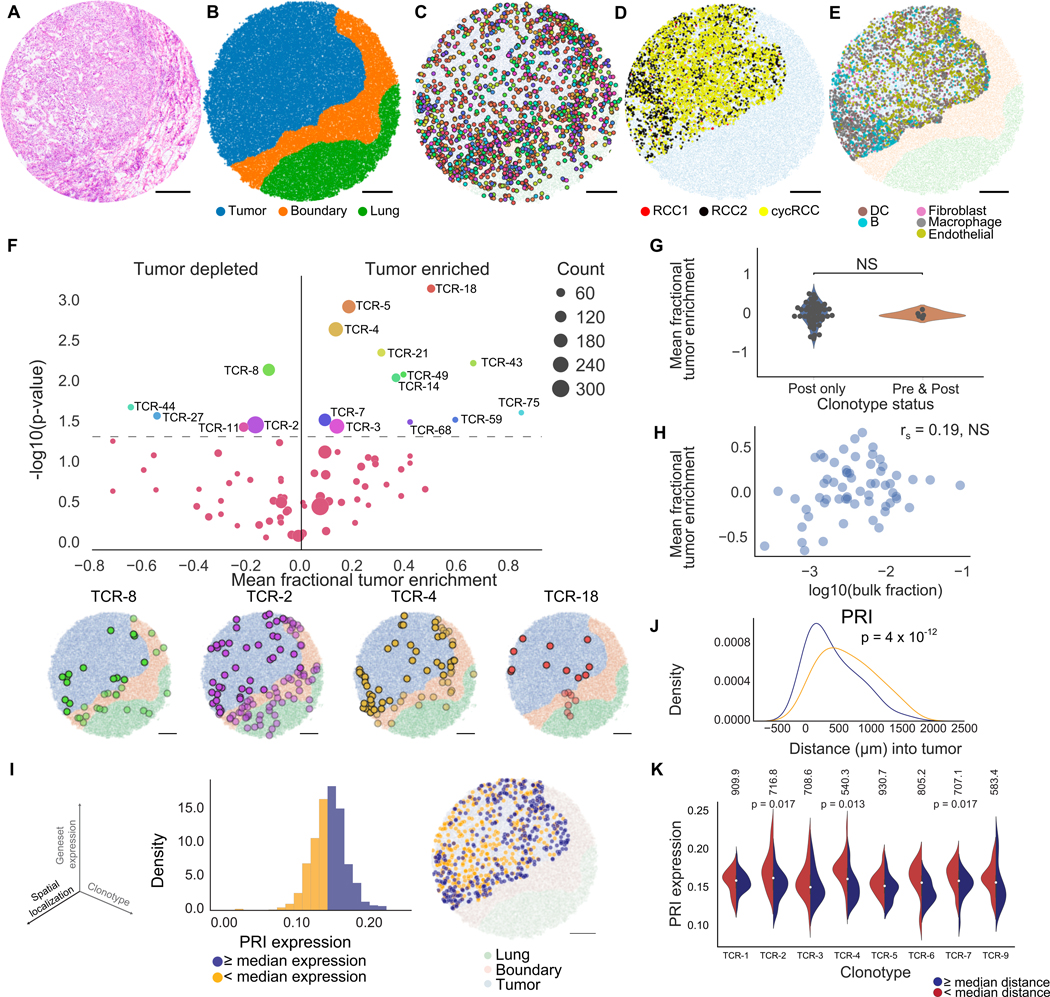
Figure 3. Slide-TCR-seq identifies spatial differences between T cell clonotypes in renal cell carcinoma.
(A) H&E stain of an RCC metastasis to the lung following treatment with a PD-1 inhibitor.
(B) Compartment assignment of the lung (green), boundary (orange), and tumor (blue) of a representative Slide-TCR-seq array from three replicates by applying K-nearest neighbors to cell types determined by unsupervised clustering.
(C) Spatial localization of T cell clonotypes (n=549 clonotypes, colored by clonotype) of a representative Slide-TCR-seq array from three replicates.
(D) Within-tumor spatial localization of 3 distinct RCC cell subtypes (STAR Methods) of a representative Slide-TCR-seq array from three replicates.
(E) Within-tumor spatial localization of a representative Slide-TCR-seq array from three replicates of the five most abundant non-tumor non-T cell types as determined by RCTD and using the combination of five scRNA-seq datasets as reference. DC = dendritic cell.
(F) Top: Significance of clonotype spatial distributions compared against all other clonotypes with at least ten beads per array from the post-treatment specimen plotted against tumor enrichment (n=3 serial arrays, two one-tailed K-S tests) with Bottom: Visualization of selected significant clonotypes, ordered by tumor enrichment, in tissue compartments for a single array (T cells within the tumor compartment are displayed as opaque, T cells within other compartments are shown as translucent).
(G) Comparison of the tumor enrichment of clonotypes that are exclusive to the post-treatment sample (n=48 clonotypes) versus clonotypes that are shared with the pre-treatment sample (n=5 clonotypes) across all serial arrays.
(H) Lack of correlation between the mean tumor enrichment of clonotypes in Slide-TCR-seq and their fraction in bulk TCR-seq from the same post-treatment specimen, by Spearman’s correlation.
(I) Left: The three axes – spatial localization, gene expression, and T cell clonotype – that Slide-TCR-seq can relate. Center: distribution of poor response to immune checkpoint inhibitor treatment (‘PRI’) gene set expression across all clonotypes in the tumor region for the post-PD-1 inhibitor RCC lung metastasis in a single array with kernel density estimation. Yellow = clonotypes with lower than median PRI expression; purple = clonotypes with PRI expression greater than or equal to the median value. Right: localization of low (yellow) and high (purple) PRI gene set expression clonotypes within the tumor region (light blue) from the Slide-TCR-seq array shows their distinct spatial separation (light blue = tumor region, orange = boundary region, green = lung region).
(J) Smoothed histograms comparing the distance infiltrated into the tumor by two-tailed K-S test comparing low (yellow) and high (purple) expression clonotypes, as dichotomized by median expression of PRI.
(K) Expression of PRI gene set across clonotypes with at least 20 beads (n=7 clonotypes), dichotomized based on each clonotype’s median distance infiltrated into the tumor from the tumor edge (red = less infiltrated, blue = more infiltrated; the median distances in μm are displayed along the top). TCR-4 exhibited higher PRI expression when localized closer to the tumor edge than farther from the edge (by two-tailed K-S test). See STAR Methods for n of each distribution. All scale bars: 500 μm. NS = nonsignificant. See also Figures S3–5.

