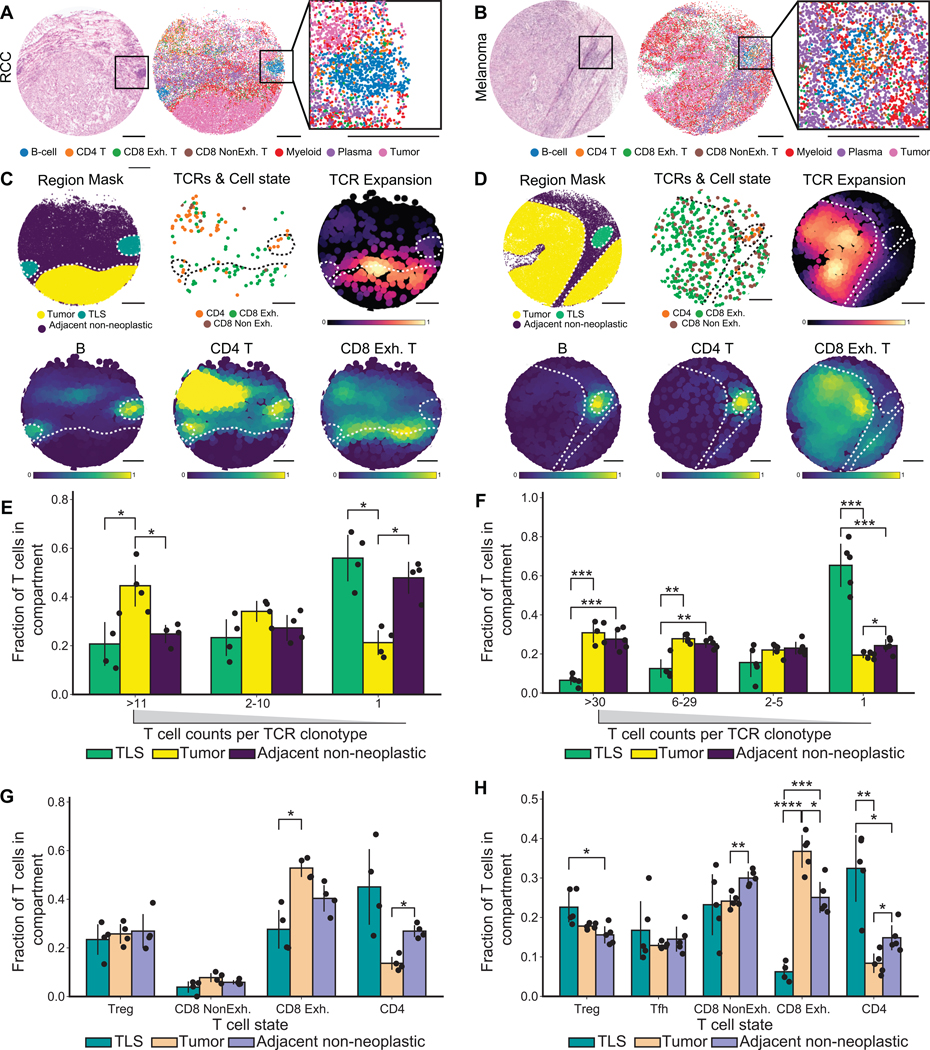
Figure 4. Clonal expansion and T cell state between tertiary lymphoid structures and tumor regions in renal cell carcinoma and melanoma.
(A-B) Aligned H&E of a serial section (left), representative Slide-TCR-seq array (center) with beads colored by RCTD cell type assignments, and zoomed-in Slide-TCR-seq of tertiary lymphoid structure (TLS) (right) in RCC (A) and melanoma (B).
(C-D) Region mask of a representative Slide-TCR-seq array delineating tumor, TLS, and adjacent non-neoplastic regions (top left); beads containing both CDR3 and T cell state colored by RCTD assignment (top center); Gaussian-filtered heatmap visualizing TCRs weighted by the extent of clonal expansion (top right); Gaussian-filtered heatmap normalized to maximum values in TLSs and tumor regions, visualizing the location of B cell, CD4+ T cell, and CD8+ Exhausted (Exh) T cell types (bottom); in RCC (C) and melanoma (D).
(E-F) Grouped barplot visualizing the fraction of T cells in each compartment (TLS, tumor, and adjacent non-neoplastic) grouped by the extent of clonal expansion of the T cells in RCC (E; n=4 arrays across two regions) and melanoma (F; n=5 arrays across three regions).
(G-H) Grouped barplot visualizing the fraction of T cells in each compartment (TLS, tumor, adjacent non-neoplastic) grouped by their T cell states in RCC (G; n=4 arrays across two regions) and melanoma (H; n=5 arrays across three regions).
Barplots indicate means and error bars indicate standard deviation of replicates. All scale bars: 500 μm. All statistical tests are by t-test and corrected for false discovery rate, * p = 0.05, ** p = 0.005, *** p = 0.0005, **** p = 0.00005. Treg = regulatory T cell; Tfh = follicular T helper cell; NonExh = non-exhausted; Exh = exhausted. See also Figure S5.

