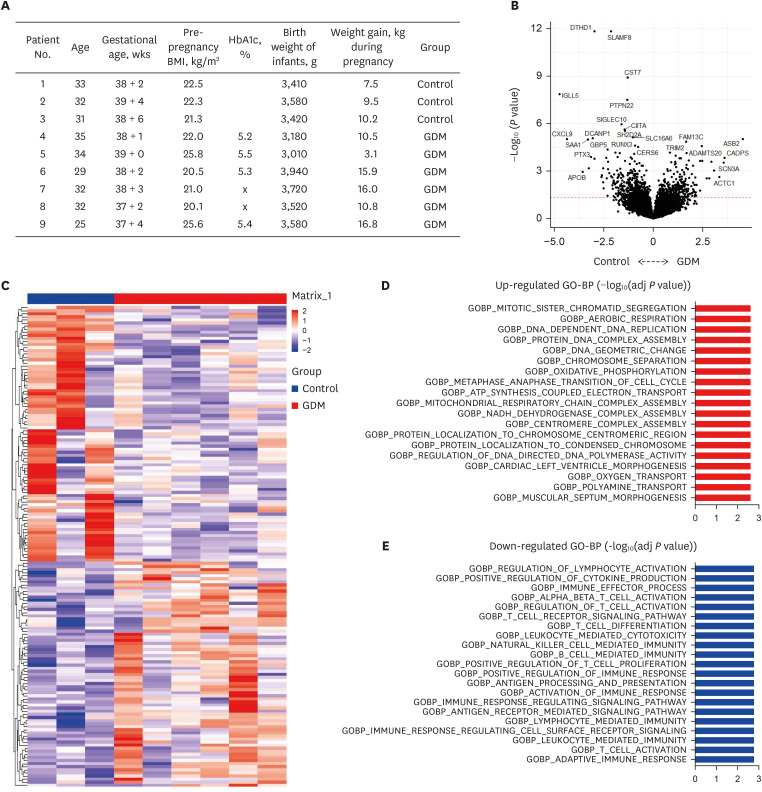
Fig. 1. Clinical information and differentially expressed canonical pathways in comparison between GDM patients and controls. (A) Clinical information including age, BMI, glycosylated hemoglobin (HbA1c), BMI, birth weight of infants, and weight gain. (B) DEGs in comparison between GDM patients and controls by volcano plot analysis. (C) Heatmap analysis of DEGs. (D) Upregulated differentially expressed canonical pathways in comparison between GDM patients and controls. (E) Downregulated differentially expressed canonical pathways in comparison between GDM patients and controls.
GDM = gestational diabetes mellitus, BMI = body mass index, HbA1c = hemoglobin A1c, DEG = differentially expressed gene.

