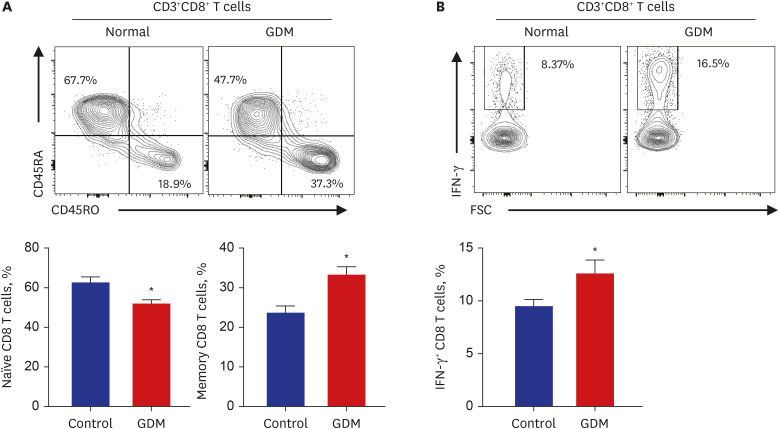
Fig. 3. Immunophenotype of CD8+ T cells of the maternal placenta in pregnant women with and without GDM. (A) Representative flow cytometry plots are presented for CD45RA and CD45RO expression by CD8+ T cells in patients with GDM (n = 6) and normal controls (n = 8). Statistical analysis of the population of CD45RA+CD45RO− (naïve) or CD45RA−CD45RO+ (memory) T cells in CD8+ T cells in the two groups. (B) The frequency of IFN-γ-secreting cells in the population of CD8+ T cells was compared between the two groups. Data are expressed as mean ± standard error of the mean. Flow cytometry plots are representative of all independent experiments.
GDM = gestational diabetes mellitus, IFN = interferon, IL = interleukin, FSC = forward scatter.
*P < 0.05 compared with the corresponding controls.

