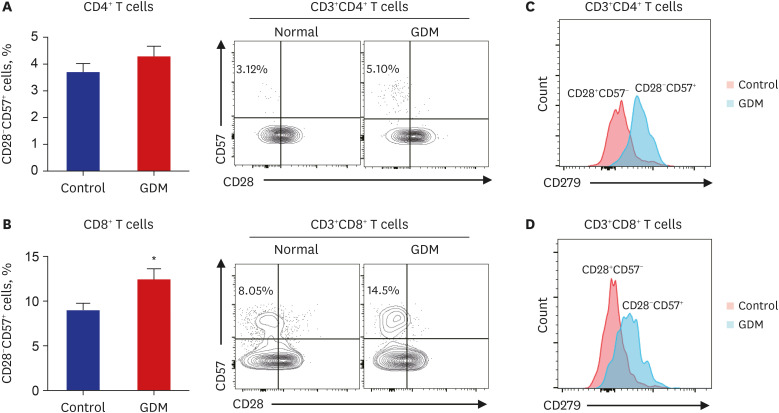
Fig. 4. Population size of CD28−CD57+ senescent T cells from normoglycemic subjects and patients with GDM. (A, B) Representative flow cytometry plots are presented for CD57 and CD28 expression by CD4+ or CD8+ T cells in patients with GDM (n = 6) and normal controls (n = 8). Statistical analysis of the population of CD28− and CD57+ T cells in CD4+ and CD8+ T cells in the two groups. (C, D) CD279 (PD-1) expression of placental CD4+ and CD8+ T cell subsets from patients with GDM and normal controls. Data are expressed as mean ± standard error of the mean. Flow cytometry plots are representative of all independent experiments.
GDM = gestational diabetes mellitus, PD-1 = programmed cell death-1.
*P < 0.05 compared with the corresponding controls.

