
Fig. 2.
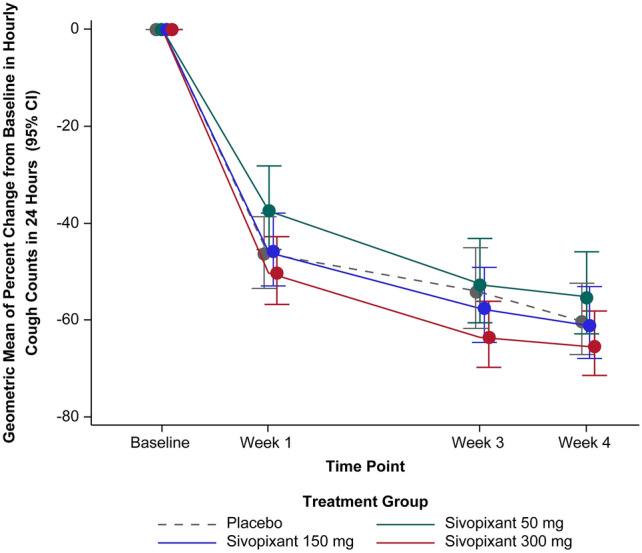
Geometric mean of percent change in hourly cough counts in 24 h from baseline to weeks 1 to 4 (FAS). Treatment effects and their 95% CIs plotted are based on a mixed-effects model for the log-transformed ratio of the number of coughs/h in 24 h at Weeks 1, 3 and 4, with treatment group, week, and interaction between treatment group and week as fixed effects; patient as random effect; and region and the log-transformed coughs/h in 24 h at baseline as covariates. Modeled estimates are presented as geometric mean of percent change from baseline. CI confidence interval, FAS full analysis set