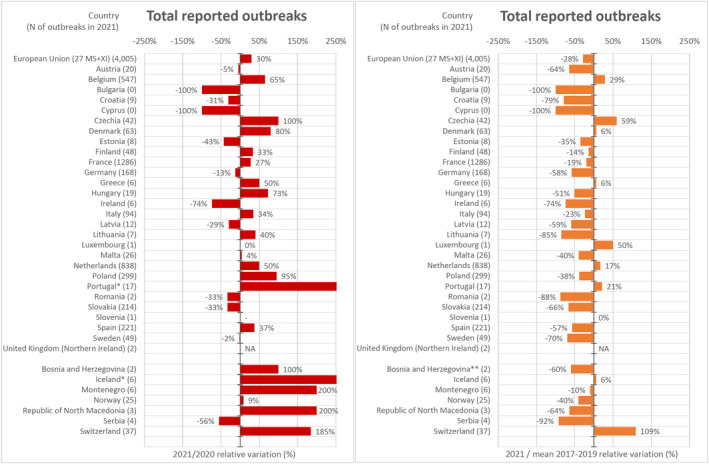
Figure 30.

- * 2021/2020 relative variation for Portugal was 325% and for Iceland was 500%. ** The mean annual total of FBOs reported by Bosnia and Herzegovina was calculated considering only the years 2017–2018, since no FBO data were reported in 2019.
