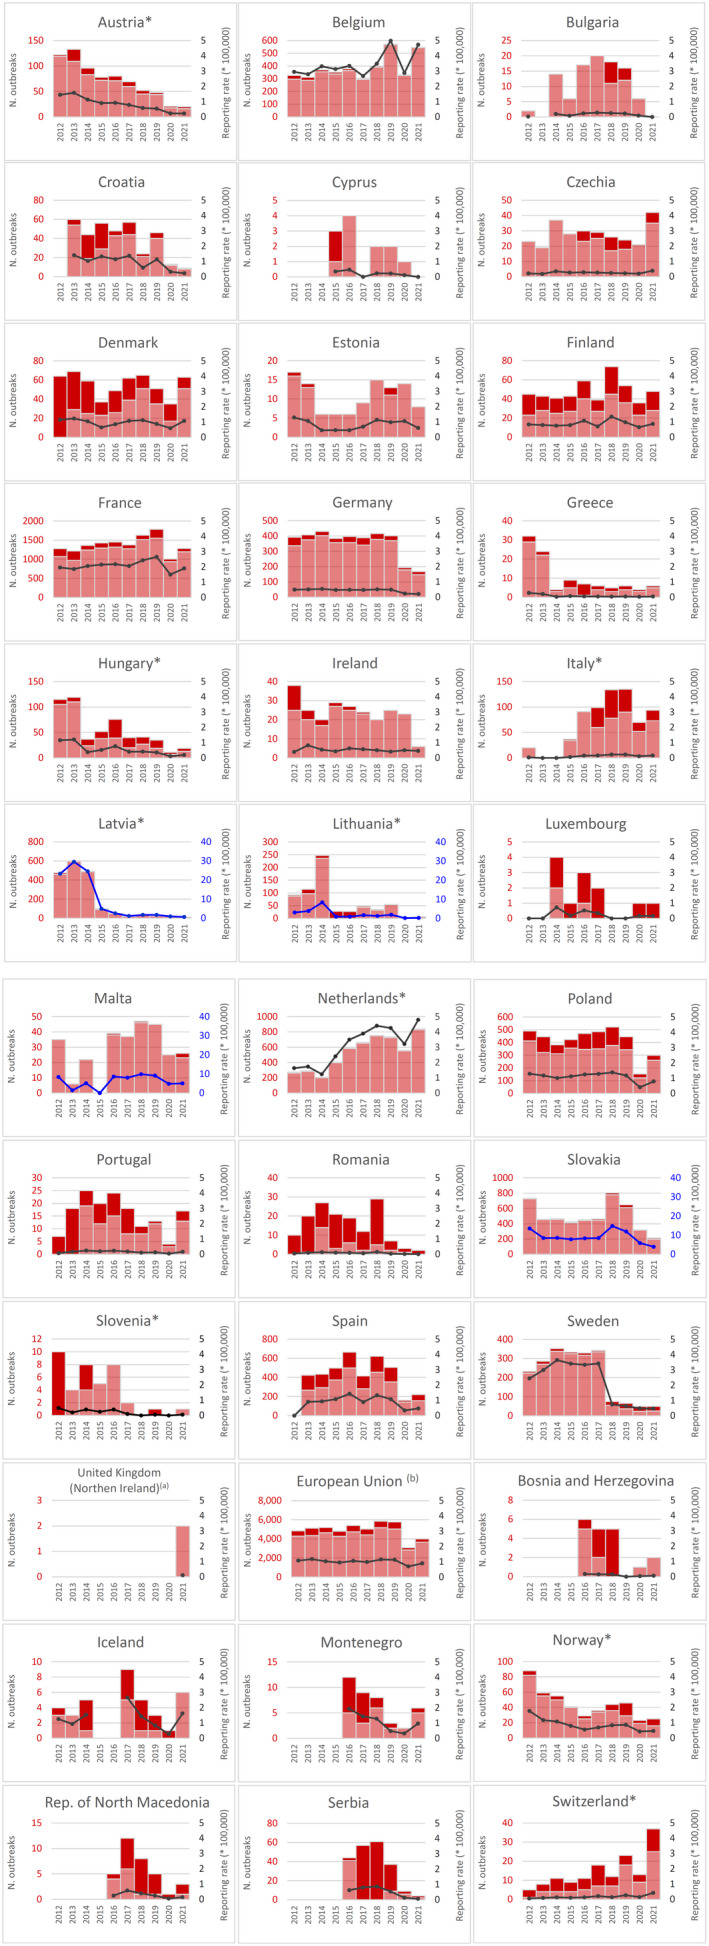
Figure 31.

- Note: * indicates countries with a statistically significant trend (p < 0.05) over the period. Dark red and light red show strong‐ and weak‐evidence outbreaks, respectively. Black dots and lines show FBO reporting rates. The dots, lines and secondary Y‐axis in blue showing the outbreak reporting rates have been used for Latvia, Lithuania, Malta and Slovakia, in order to draw attention to a scale that is different to that of the other countries. (a): Data on FBOs from the United Kingdom (Northern Ireland) are taken into account for 2021. In accordance with the agreement on the withdrawal of the United Kingdom from the EU, and in particular with the Protocol on Ireland/Northern Ireland, the EU requirements on data sampling are also applicable to Northern Ireland. (b): Data on FBOs from the United Kingdom are taken into account for 2017–2019, because the United Kingdom was an EU MS, but it became a third country on 1 February 2020.
