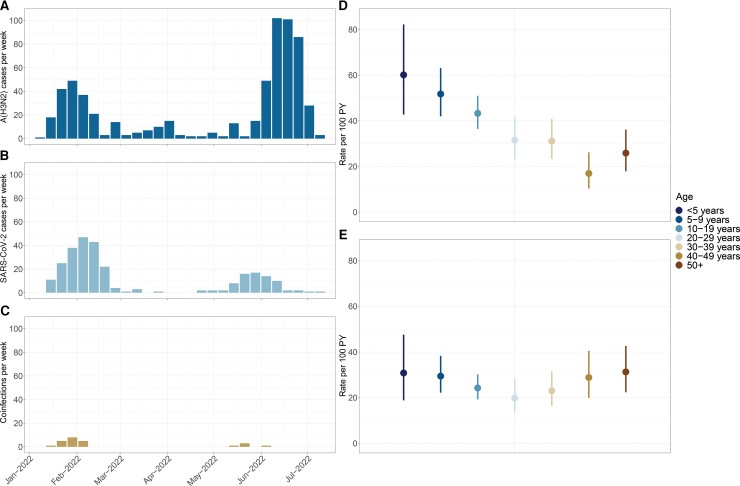
Figure 1.
Influenza and severe acute respiratory syndrome coronavirus 2 (SARS-CoV-2) in the cohort. A–C, Number of cases per week for influenza A(H3N2) (A), SARS-CoV-2 (B), and A(H3N2)/SARS-CoV-2 coinfections (C). D and E, Incidence rate (per 100 person-years [PY]) by age for influenza A(H3N2) and SARS-CoV-2, respectively.

