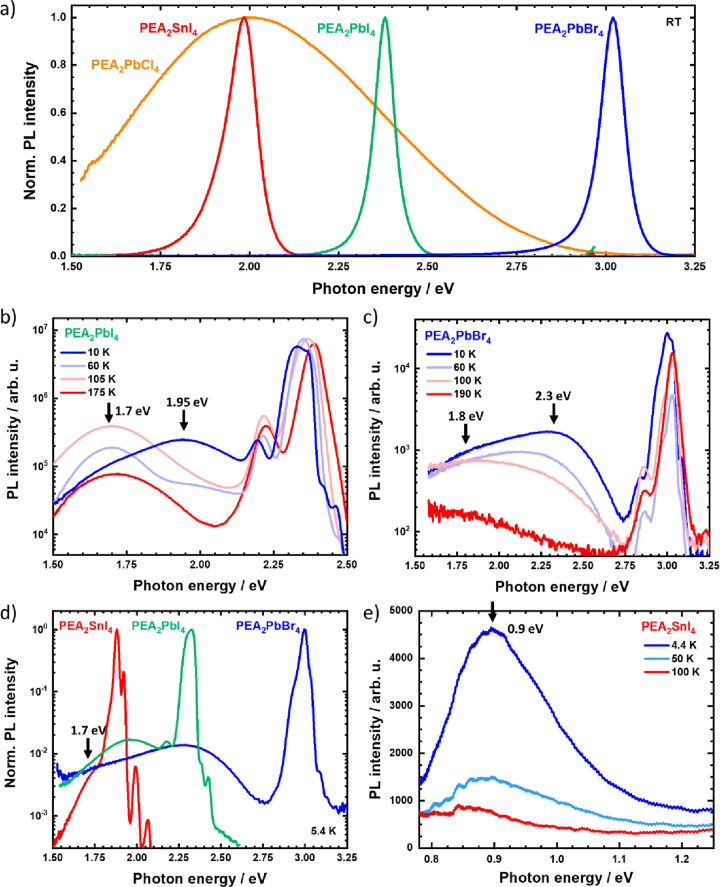
Figure 1.
Photoluminescence spectra of the studied compounds under different conditions (excitation at 4.6 eV for PEA2PbCl4; 3.1 eV for the others). (a) Room-temperature spectra in the visible range on a linear scale. Semilogarithmic spectra of PEA2PbI4 (b) and PEA2PbBr4 (c) upon temperature variation. The black arrows indicate the peak energy of the emerging broad emission bands. (d) Comparison of PEA2PbBr4, PEA2PbI4, and PEA2SnI4 PL at 5.4 K indicating the pronounced red-shifted BE in all cases. (e) PL of PEA2SnI4 in the near-infrared spectral region upon temperature variation. The arrow identifies an additional BE at 0.9 eV.

