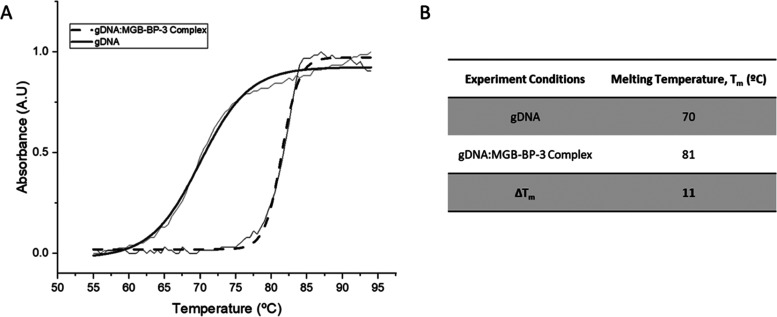
Figure 4.
Thermal melt curves of gDNA (salmon) and gDNA:MGB-BP-3 Complex. (A) Exemplar melt curve from one experimental repeat, visually representing the different melt curves of gDNA and the gDNA:MGB-BP-3 Complex. Data has been fitted with a Boltzmann distribution. (B) Melting temperatures of gDNA and gDNA:MGB-BP-3 Complex calculated from fitted Boltzmann distributions using OriginPro 2021. All values are an average for n = 4 experimental repeats with an error of ±1 °C.

