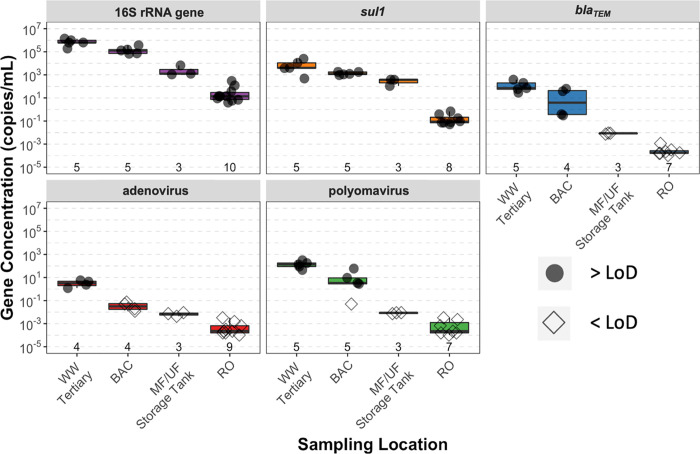
Figure 2.
Boxplots of qPCR results for the 16S rRNA gene, two antibiotic resistance genes (sul1 and blaTEM), and two enteric viruses (human adenovirus and JC polyomavirus). Shown immediately above the x-axis are the total number of samples for each qPCR assay at each sampling location. Data shown for RO include measurements from two parallel treatment processes. Results above the limit of detection (>LoD) are shown as open circles and results below the limit of detection (<LoD) are shown as open diamonds. Note that the LoD varied based on the volume of water filtered for each sampling event. All qPCR assays were carried out in technical triplicate. The apparent decreasing concentrations for blaTEM, adenovirus, and polyomavirus are due to the decrease in the LoD achieved by concentrating larger volumes of sample for each subsequent unit process; thus, these values represent a lower bound of removal. Sample numbers varied because there was insufficient extracted DNA to supply every qPCR assay.

