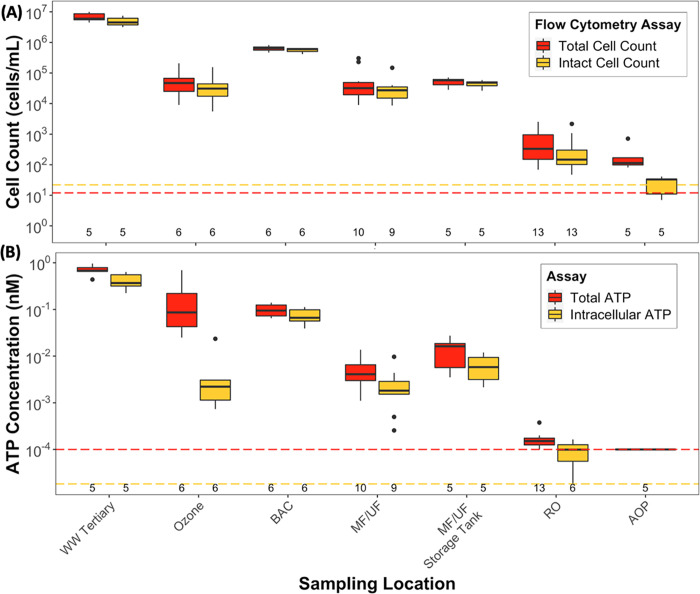
Figure 3.
Boxplots of (A) total and intact cell counts and (B) total and intracellular ATP throughout the advanced treatment train. Data shown for MF/UF and RO include measurements from two parallel treatment processes. The lower limits of quantification for total and intact cell counts (12 and 22 cells/mL) and total and intracellular ATP (1 × 10⁻⁴ and 1.82 × 10⁻⁵ nM) are indicated by the red and yellow colored lines, respectively. The total number of samples taken (n) at each location is reported immediately above the x-axis. All samples were analyzed in technical triplicate. A complementary graph (Figure S2) showing log10 reduction values at each treatment step is available in the Supplementary Information. Sample numbers are lower for some sampling locations because, due to logistical challenges, we were unable to complete analyses on all samples on one sample day (October 10, 2017) and intracellular ATP analysis on RO permeate was discontinued after three sampling days to reduce daily sample processing time.

