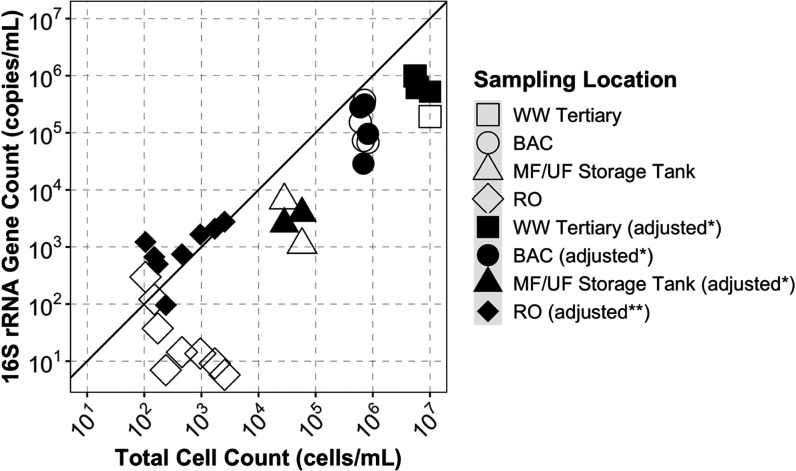
Figure 4.
Scatterplot of the 16S rRNA gene count and total cell count in all bulk water samples from the advanced treatment train. All samples were analyzed in technical triplicate by both qPCR and flow cytometry. For visual reference, a 1:1 correlation is shown by a solid, black line. Sample points where results are not adjusted for recovery are shown as open shapes. Sample points where qPCR results for the 16S rRNA gene were adjusted to account for recovery are shown as solid fill. For recovery-adjusted results, *16S rRNA gene concentrations for samples of tertiary wastewater, BAC, and MF/UF storage tank were adjusted for primary recovery only, but **samples of RO permeate were adjusted for both primary and secondary recovery. Two tertiary wastewater samples had >99% recovery by the primary concentration, and the nonadjusted points are hidden behind adjusted points.

