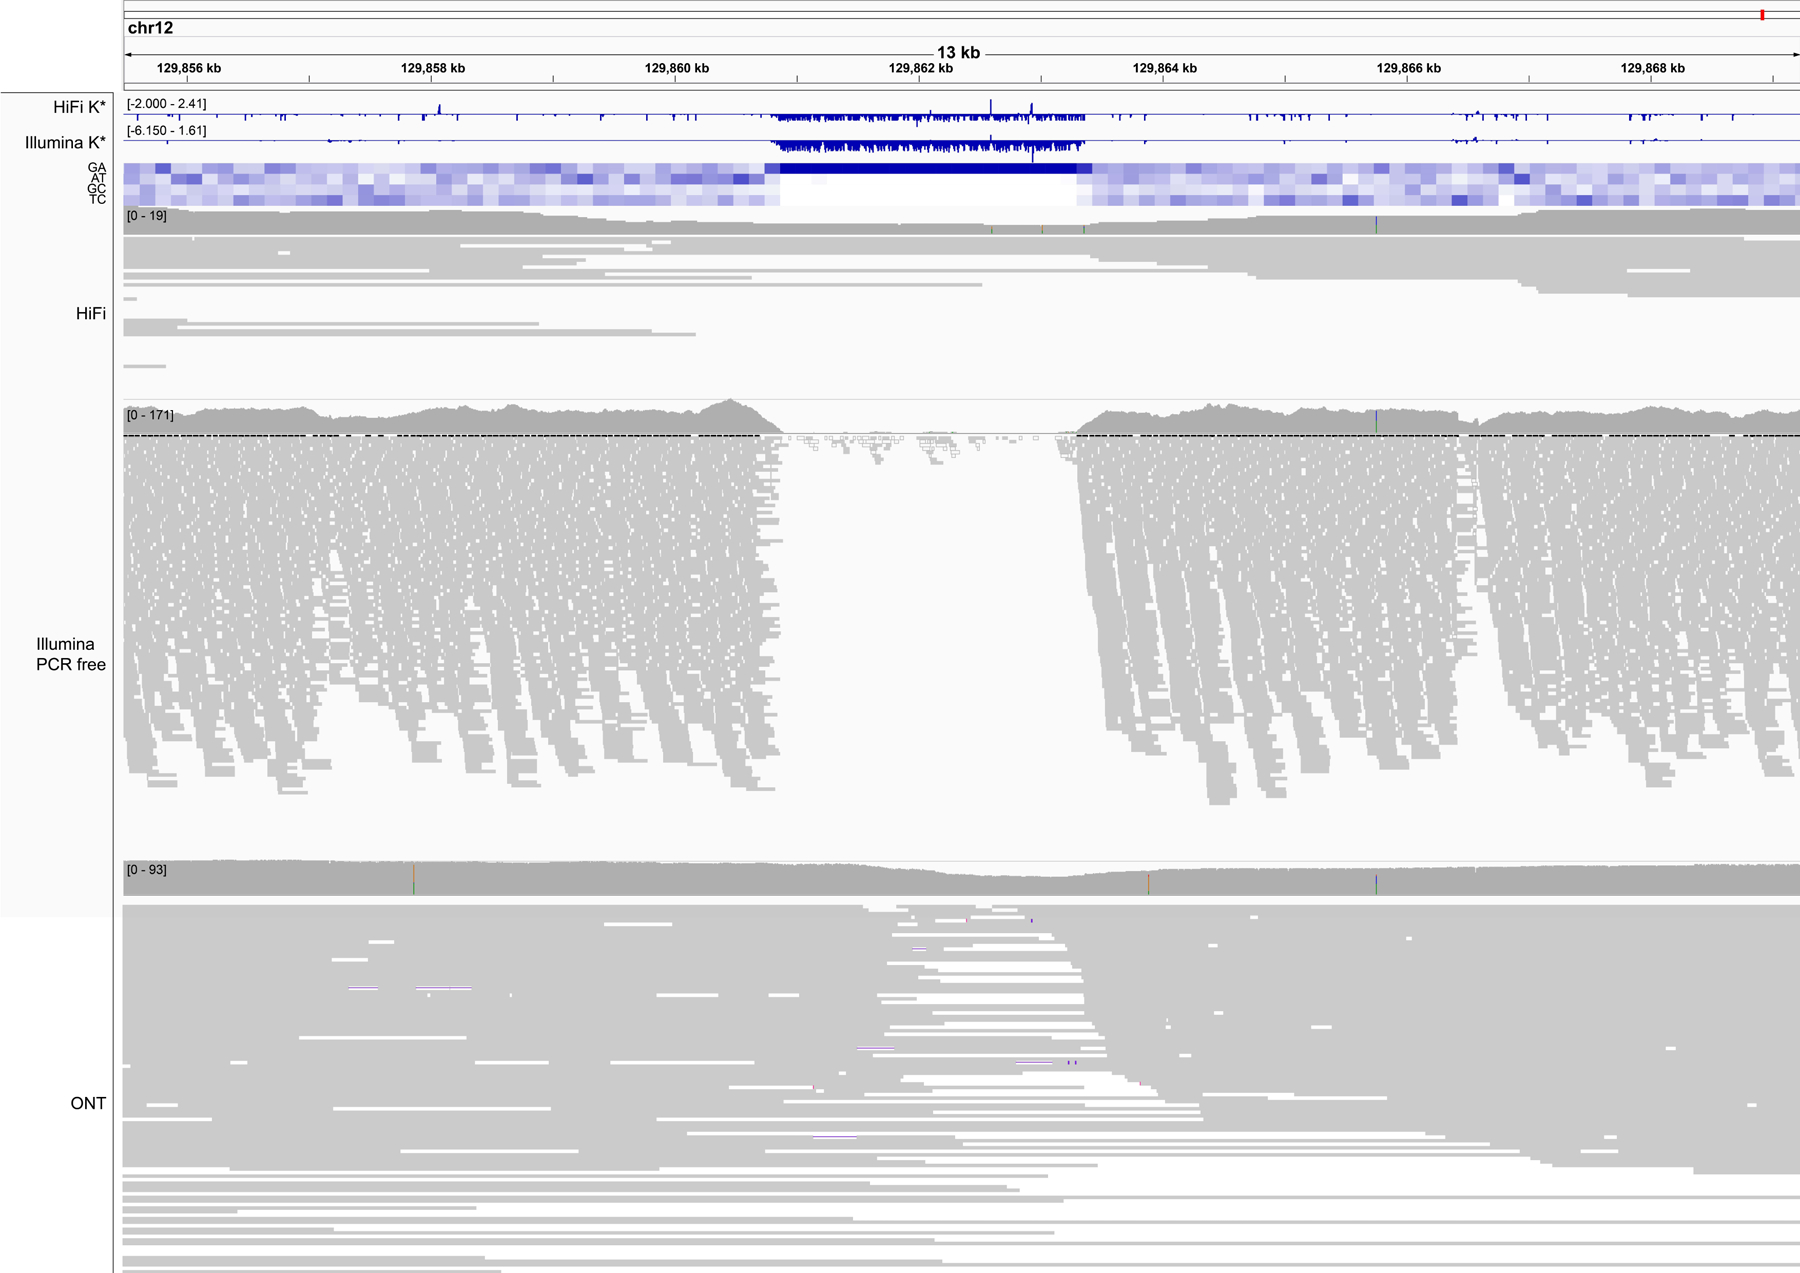
Extended Data Fig. 3 |. A region of negative K* highlighting sequencing bias.

An example of low coverage in both HiFi and Illumina reads associated with high guanine content, and specifically a GA-rich repeat (heatmap). GA bias has been reported in PacBio HiFi data, and results in gaps in the assembly that in CHM13 were filled with Nanopore data22. The K* both from HiFi and Illumina k-mers (top tracks) recapitulate the coverage drop. Nanopore coverage appears less affected. Position Chr. 12:~129,862,000 bp.
