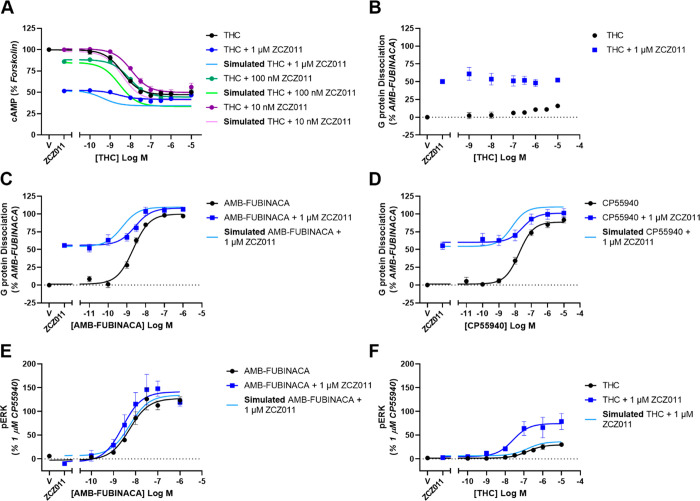
Figure 2.
Concentration–response curves showing the G protein dependent signaling of ZCZ011 in combination with orthosteric agonists in HEK293-hCB1 cells compared to simulations of additive agonism. (A) Inhibition of cAMP stimulated by 5 μM forskolin and THC in the absence and presence of ZCZ011, (B–D) dissociation of Gαi3 and Gβγ subunits as determined by TRUPATH BRET assay stimulated by THC (B), AMB-FUBINACA (C), or CP55940 (D) alone and in the presence of 1 μM ZCZ011. (E–F) Phosphorylation of ERK1/2 by AMB-FUBINACA (E), or THC (F). Data has been normalized to appropriate controls and pooled across five independent biological replicates (n = 5). Data is expressed as mean ± SEM.

